
Pharmaceutical illustration is a specialized branch of biomedical visual communication that produces scientifically accurate, graphically precise static or sequential visual representations of drug mechanisms, molecular pharmacology, biological pathways, drug delivery systems, and dosage form interactions – created specifically for use across pharmaceutical marketing, clinical education, regulatory documentation, scientific publishing, and investor communication. At the molecular and cellular level, it encompasses mechanism-of-action (MoA) diagrams, drug-receptor binding visualizations, pharmacokinetic pathway charts, and signal transduction cascade illustrations, all produced to the scientific accuracy standards required by pharmaceutical companies, biotech firms, and academic research institutions. For any organization operating within the global pharmaceutical market – valued at over $1.77 trillion in 2025 and projected to exceed $3.2 trillion by 2035 – the ability to communicate complex drug science visually is no longer a peripheral capability; it is a core commercial and scientific competency.
The pharmaceutical industry faces a fundamental communication challenge: the science behind modern drug development is extraordinarily complex, yet the audiences who need to understand it span a spectrum from molecular biologists to patient caregivers. Pharmaceutical illustration closes that gap. It transforms receptor binding kinetics, intracellular signaling cascades, and nanoscale drug delivery mechanics into visuals that work at every level of scientific literacy.
This guide examines what pharmaceutical illustration is, why it is indispensable across the drug development lifecycle, what forms it takes, how it is produced, and how pharma teams can commission work that drives measurable commercial and scientific outcomes.
If your team requires a full suite of end-to-end pharmaceutical illustration and molecular visualization services, The Medical Illustration Company provides scientifically validated, revision-unlimited illustration assets for pharma, biotech, and life sciences companies worldwide.
What is Pharmaceutical Illustration? A Precise Definition
Pharmaceutical illustration is the practice of creating scientifically grounded visual representations of pharmacological and biochemical processes. It sits at the intersection of molecular biology, pharmacology, graphic design, and biomedical communication.

Unlike general scientific illustration, pharmaceutical illustration carries specific demands:
Molecular-level precision
Illustrations must accurately depict protein structures, receptor conformations, and molecular binding geometries that are consistent with published pharmacology and, where available, crystallographic data.
Multi-audience scalability
The same drug mechanism must be communicated differently to a molecular pharmacologist, an oncology nurse, a hospital formulary committee, and a patient receiving a first prescription.
Regulatory compliance awareness
Illustrations used in FDA submissions, Prescribing Information (PI) documents, and promotional materials must conform to regulations governing accurate drug representation.
Brand and narrative alignment
In a commercial context, pharmaceutical illustrations simultaneously serve as scientific communication tools and brand-building assets.
The discipline covers a broad content range: from nanoscale molecular docking visualizations to whole-body pharmacokinetic distribution diagrams; from subcellular signal transduction cascades to patient-facing anatomical drug delivery illustrations.
Quick Answer: Pharmaceutical illustration is the creation of scientifically accurate visual representations of drug mechanisms, molecular pathways, pharmacokinetics, and drug delivery systems – used in pharma marketing, HCP education, clinical trials, regulatory documentation, scientific publications, and patient communication.
Why the Pharmaceutical Industry Relies on Visual Communication
The global pharmaceutical market is not just large – it is scientifically dense. According to Grand View Research, the market was valued at approximately $1.77 trillion in 2025 and is growing at a CAGR of 6.1% through 2033. Within this environment, the ability to communicate drug mechanisms clearly and compliantly is a competitive advantage with measurable financial impact.
Here is precisely why pharmaceutical illustration is a strategic investment rather than a visual nicety.
HCPs Make Prescribing Decisions Based on Scientific Understanding
A healthcare provider who fully understands how a drug works at the receptor, cellular, and systemic level is significantly more likely to prescribe it appropriately and confidently. A pharmaceutical illustration that shows exactly how a biologic modulates a specific cytokine pathway – or how a small molecule inhibits a kinase – communicates that science in seconds rather than paragraphs.
Medical science liaisons (MSLs) and pharmaceutical sales representatives equipped with high-quality MoA illustrations consistently report improved HCP engagement compared to text-heavy detail aids.
Investors Need to See the Science Before They Fund It
Biotech and pharma investor presentations live or die on their ability to translate pipeline science into visually compelling, comprehensible propositions for non-specialist audiences. A mechanism-of-action illustration that shows drug-target engagement, downstream pathway modulation, and therapeutic outcome within a single visual panel builds investor conviction in ways that written descriptions simply cannot replicate.
Regulatory Reviewers Benefit from Visual Clarity
While FDA and EMA review processes are text-and-data primary, well-executed pharmaceutical illustrations in submission packages – particularly for complex biologics, gene therapies, and novel small molecules – help reviewers rapidly build mechanistic understanding. This clarity can accelerate the review process and reduce the need for time-consuming clarification requests.
Patient Adherence Improves When Mechanisms Are Understood
Research consistently demonstrates that patients who understand how their medication works show higher adherence rates. A clear, patient-calibrated pharmaceutical illustration showing where a drug acts in the body, what it does at the cellular level, and how it produces its therapeutic effect directly supports informed consent quality and long-term treatment compliance.
For a broader understanding of why visual content is foundational to healthcare outcomes at every level, the overview of why medical illustrations matter across clinical and commercial settings provides essential context.
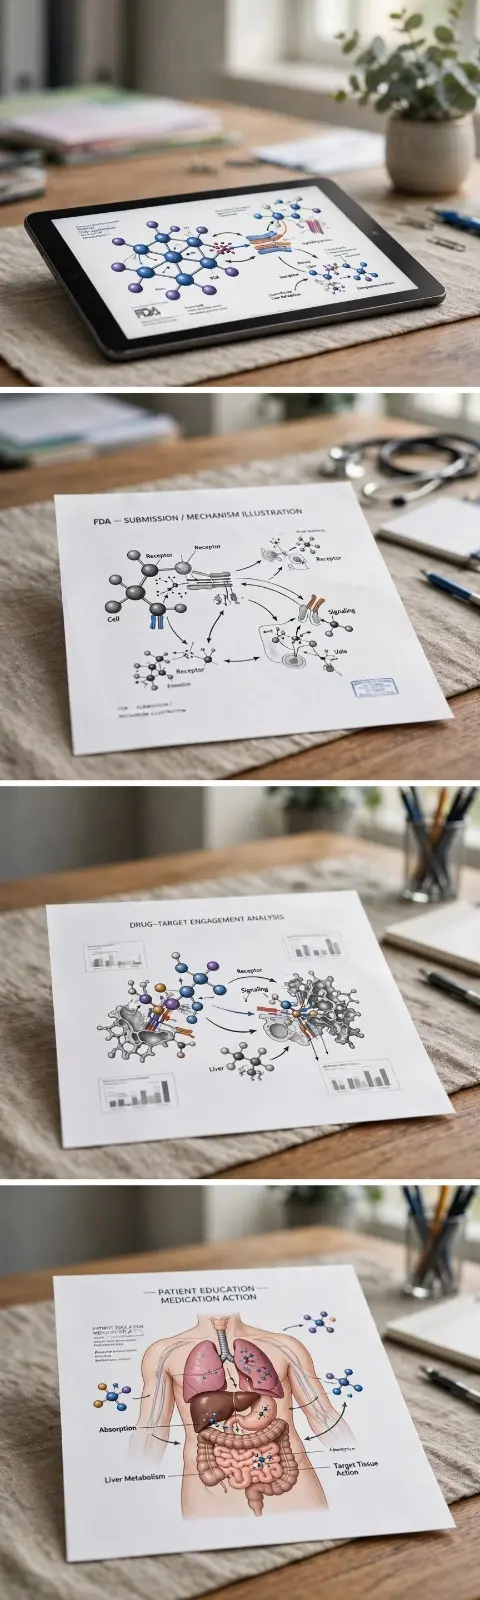
Types of Pharmaceutical Illustration
The scope of pharmaceutical illustration is wide. Each format serves a distinct communication purpose and a specific audience type.
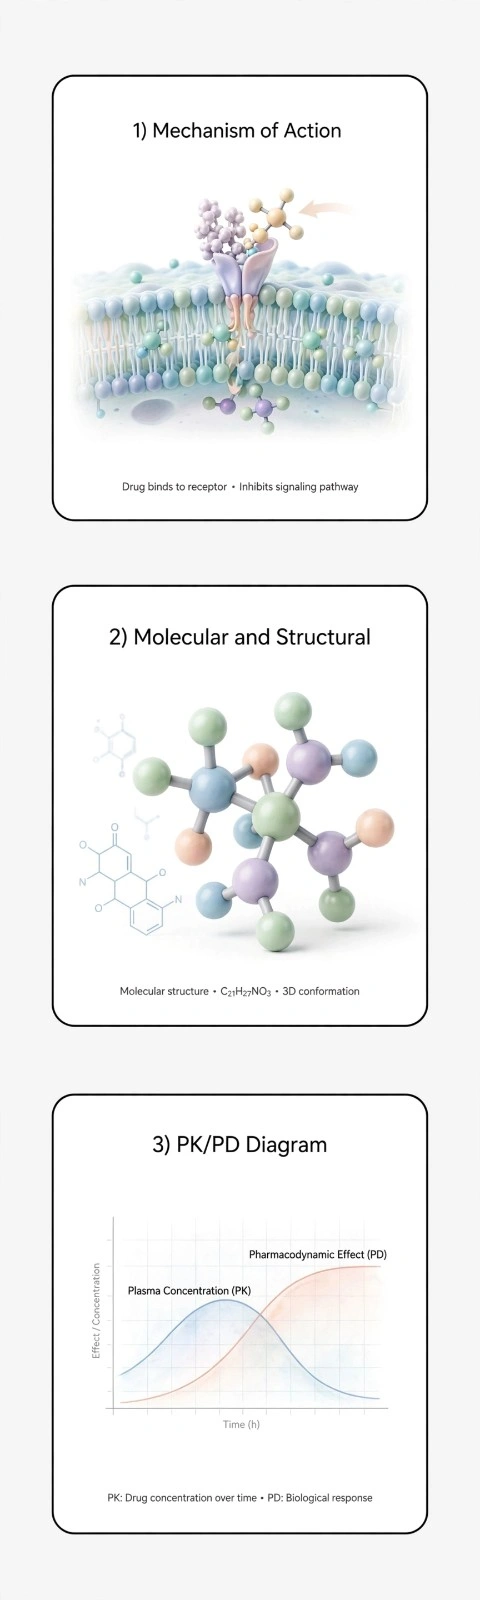
Mechanism of Action (MoA) Illustration
The most strategically significant category in commercial pharma, MoA illustrations show precisely how a drug interacts with its molecular target – receptor binding, enzyme inhibition, ion channel modulation, DNA intercalation, or receptor tyrosine kinase blockade – and the downstream biological consequences of that interaction. These are presented as either single-panel infographics or multi-panel sequential diagrams showing the complete pharmacological cascade.
High-quality MoA illustrations are built from published pharmacology literature, crystal structure databases such as the RCSB Protein Data Bank, and client-supplied clinical data packages. Accuracy at this level is non-negotiable; a mechanistically incorrect MoA illustration constitutes a potential regulatory and liability issue in any promotional material.
Molecular and Structural Illustration
At the sub-cellular level, pharmaceutical illustration covers protein tertiary and quaternary structure rendering, antibody-antigen binding visualization, small molecule docking in binding pocket geometry, RNA-protein interaction diagrams, and CRISPR-Cas9 gene editing complex illustrations. These are used primarily in scientific publications, patent applications, and high-science investor materials.
For research teams preparing figures for peer-reviewed journals, this guide to producing visual content for research publications covers the formatting and accuracy standards that journal editors require.
Pharmacokinetic and Pharmacodynamic (PK/PD) Diagrams
PK/PD illustrations map the journey of a drug through the body: absorption, distribution, metabolism, and excretion (ADME) – alongside the drug’s dose-response relationship, therapeutic window, and time-action profile. These diagrams are used in clinical pharmacology sections of regulatory submissions, medical education materials, and HCP communication programs.
Drug Delivery System Illustration
Modern drug delivery is itself a field of extraordinary complexity: nanoparticle-encapsulated payloads, liposomal formulations, antibody-drug conjugates (ADCs), implantable controlled-release systems, transdermal patch architectures, and inhaler mechanism diagrams. Illustrating these systems requires the ability to depict both the engineering of the delivery vehicle and its biological interaction with target tissue or cellular compartments.
Disease State and Pathophysiology Illustration
Before a drug’s mechanism can be understood, the audience needs to understand what the disease biology looks like without intervention. Disease state illustrations depict the aberrant biology that the drug targets: the inflammatory cytokine cascade in autoimmune disease, the uncontrolled cellular proliferation in oncology, or the amyloid plaque formation in neurodegenerative conditions. These are foundational for HCP education, patient communication, and payer communication materials alike.
Clinical Trial and Study Design Infographics
Clinical trials require complex data to be communicated clearly to multiple audiences: investigators, IRBs, patients, payers, and regulators. Trial design infographics present primary and secondary endpoints, inclusion and exclusion criteria, dosing schedules, patient stratification, and interim analysis milestones in a format that can be understood in under two minutes.
Dosage Form and Packaging Illustration
Pharmaceutical illustration also encompasses the physical product: tablet cross-section diagrams showing extended-release layer architecture, capsule fill-and-seal mechanism illustrations, prefilled syringe assembly diagrams, and transdermal patch construction cutaways. These are used in regulatory technical documents, patient education inserts, and manufacturing quality documentation.
Overview of Pharmaceutical Illustration Types
Types of Pharmaceutical Illustration cover a broad range of scientific and medical visuals designed to communicate complex pharmaceutical concepts with clarity and accuracy. Mechanism of Action (MoA) illustrations explain how a drug interacts with its molecular target and produces its therapeutic effect, while Molecular and Structural illustrations visualize proteins, antibodies, DNA, RNA, and small-molecule interactions at the microscopic level. Pharmacokinetic and Pharmacodynamic (PK/PD) diagrams demonstrate how a drug is absorbed, distributed, metabolized, excreted, and how it generates its biological response over time. Drug Delivery System illustrations depict advanced delivery technologies such as nanoparticles, liposomes, inhalers, implants, and transdermal patches. Disease State and Pathophysiology illustrations show the underlying biological changes caused by a disease before treatment, helping audiences understand the need for therapy. Clinical Trial and Study Design infographics simplify complex research protocols, patient journeys, study endpoints, and trial timelines for investigators and stakeholders. Finally, Dosage Form and Packaging illustrations present
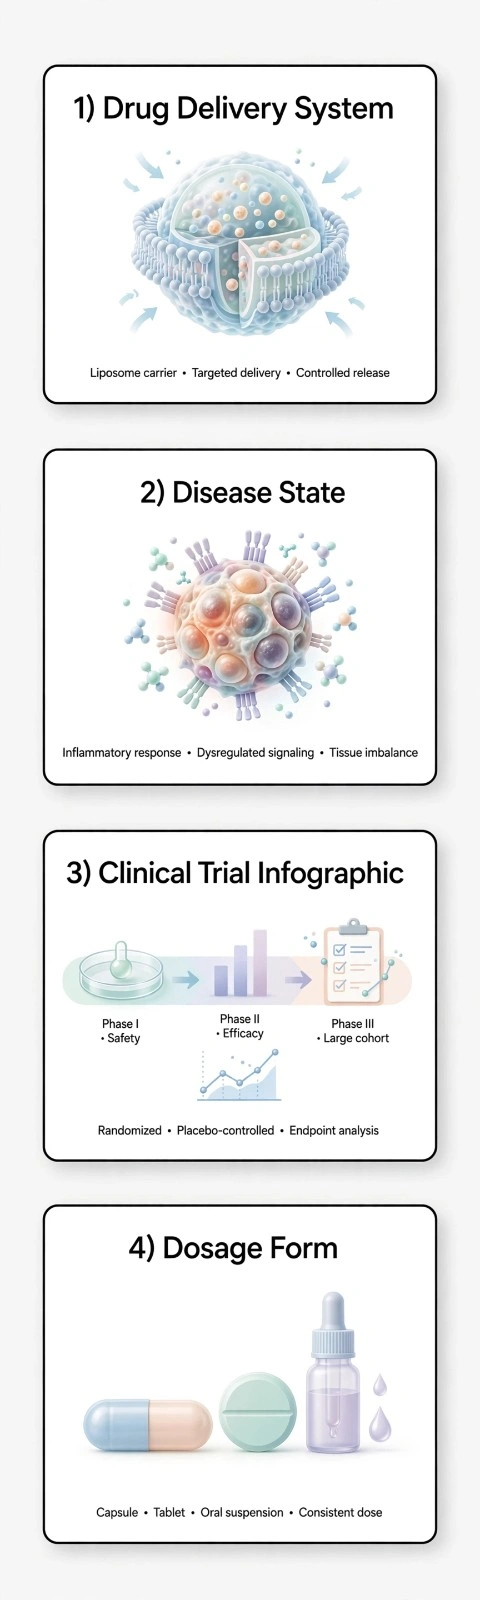
the physical design and internal structure of pharmaceutical products—including tablets, capsules, syringes, vials, inhalers, and packaging systems—for use in regulatory submissions, manufacturing documentation, medical education, and patient communication. Together, these illustration types transform highly technical pharmaceutical information into clear, engaging, and scientifically accurate visual content for researchers, healthcare professionals, regulators, investors, and patients.
Key Applications: Pharmaceutical Illustration Across the Drug Development Lifecycle
Application Table: Illustration Type by Development Stage
| Development Stage | Illustration Type | Primary Audience |
|---|---|---|
| Discovery and Lead Optimization | Molecular docking, protein structure, binding pocket visualization | Internal research teams, academic collaborators |
| Pre-Clinical | In vitro and in vivo mechanism diagrams, ADME pathway charts | Regulatory affairs, scientific advisory boards |
| IND Application | Mechanism summary diagram, route-of-administration illustration | FDA reviewers, IRB committees |
| Phase I–III Clinical Trials | Trial design infographic, PK/PD diagrams, safety profile visuals | Investigators, patients, ethics committees |
| Regulatory Submission (NDA/BLA) | MoA illustration, dosage form diagram, labeling visual | FDA, EMA, PMDA, Notified Bodies |
| Medical Affairs and Launch | HCP detail aid MoA, formulary communication infographic | Prescribers, pharmacists, payer medical directors |
| Patient Communication | Simplified drug-body interaction diagram, adherence reminder visual | Patients, caregivers, pharmacy teams |
| Scientific Publication | Molecular illustration, pathway diagram, trial result figure | Journal editors, peer reviewers, academic community |
| Investor and Pipeline Communication | Pipeline MoA sequence, proof-of-concept visual | VCs, institutional investors, board members |
What Makes an Effective Pharmaceutical Illustration
Not all pharma visuals deliver equivalent scientific communication value. The following criteria clearly separate high-quality pharmaceutical illustration from generic molecular graphics.
Scientific source accuracy
Nature Chemical Biology • 2023
DOI:10.1038/s415xx.12345
Peer-reviewed data validated
Audience-calibrated abstraction
SPECIALIST
Detailed Cascade
GP
Simplified Overview
Narrative coherence
Consistent color flow • Sequential MoA
Regulatory awareness
FDA Fair Balance Guidelines • Benefit-Risk Statement
3D comprehension
TRUE 3D
Allosteric Binding
FLAT 2D
Fails to show
Oversimplified
No spatial context
Scientific source accuracy
Every molecular interaction depicted must be grounded in peer-reviewed pharmacology. The NIH-published research on molecular visualization design principles establishes that effective molecular graphics require strict fidelity to published structural and biochemical data – not artistic interpretation of biological processes.
Audience-calibrated abstraction level
A molecular pharmacologist can read a detailed signal transduction cascade with ease. A general practitioner reviewing a detail aid cannot. An effective pharmaceutical illustration calibrates the level of biological detail precisely to the audience’s scientific literacy without sacrificing the mechanistic accuracy that underpins credibility.
Narrative coherence in sequential diagrams
Multi-panel MoA sequences must tell a logical visual story: pre-treatment biology, drug introduction, target engagement, downstream effect, and therapeutic outcome. Each panel should connect visually to the next through consistent color coding, scale conventions, and compositional logic.
Regulatory awareness in promotional materials
Pharmaceutical illustrations used in promotional materials are subject to FDA regulations on fair balance, accurate representation, and prohibition of misleading visual claims. A pharmaceutical illustrator working in the commercial pharma space must understand these requirements and build regulatory compliance into the visual from the very first draft.
3D comprehension where 2D fails
Some molecular interactions – allosteric binding, protein conformational change, antibody-epitope engagement – are fundamentally three-dimensional and cannot be communicated accurately in a flat diagram. In these cases, 3D pharmaceutical illustration is necessary for scientific integrity, not simply for aesthetic preference.
For teams evaluating whether 3D visualization is appropriate for their specific communication goal, the overview of how three-dimensional visualization works across biomedical contexts provides a clear and practical decision framework.
The Pharmaceutical Illustration Production Process: Step by Step
Producing a pharmaceutical illustration to the scientific and commercial standard required by major pharma and biotech companies follows a structured, multi-stage workflow.
Step by Step
Scientific Brief &
Literature Review
Research scope & key studies
Audience & Format
Specification
Define audience & output format
Conceptual Sketch &
Visual Narrative
Storyboard & narrative plan
Scientific Accuracy
Review
Verify data & accuracy
File Delivery & IP
Transfer
Deliver files & transfer IP
Revision &
Finalization
Revise per feedback & finalize
MLR Review
Medical/Legal/Regulatory review
Detailed Illustration
Development
Create detailed artwork
Step 1: Scientific Brief and Literature Review
The process begins with a detailed scientific brief: the drug’s mechanism of action, the target molecule or receptor class, the intended therapeutic area, the primary audience, the deliverable format, and all available reference materials. Reference packages typically include published pharmacology papers, the investigator’s brochure or SmPC, receptor crystal structure files, and the company’s approved brand guidelines. The illustrator then conducts an independent literature review to validate every interaction to be depicted before any visual development begins.
Step 2: Audience and Format Specification
The appropriate illustration format – single-panel MoA, multi-panel cascade, PK/PD diagram, 3D molecular render, or simplified patient illustration – is determined by the audience and the intended medium. A detail aid MoA used in a 12-minute HCP encounter has very different visual requirements than a molecular figure destined for a Nature Reviews paper or a patient-facing hospital leaflet.
Step 3: Conceptual Sketch and Visual Narrative
A rough compositional sketch establishes the visual narrative: what the illustration shows first, how the eye moves through the diagram, what the key takeaway visual moment is, and how multi-panel sequences connect logically. This stage is critical for complex MoA sequences where the storytelling logic must be approved before detailed rendering begins.
Step 4: Scientific Accuracy Review
The concept sketch is reviewed by the client’s medical affairs, clinical pharmacology, or regulatory team before any detailed illustration work proceeds. This step catches conceptual errors at the lowest-cost stage of the entire production process.
Step 5: Detailed Illustration Development
The illustrator builds the full visual: molecular geometry, receptor structures, cellular context, anatomical background where applicable, labeling, callouts, and color-coded pathway indicators. At this stage, the illustration is cross-referenced against the source pharmacology literature for every depicted molecular interaction.
Step 6: Medical-Legal-Regulatory (MLR) Review
Illustrations destined for promotional materials, product labeling, or regulatory submissions undergo formal MLR review to verify that the visual accurately represents the drug’s mechanism as described in the approved label and published data package.
Step 7: Revision and Finalization
Client revisions are incorporated through structured rounds. A professional pharmaceutical illustration studio provides unlimited revisions until every scientific, regulatory, and aesthetic requirement is fully satisfied.
Step 8: File Delivery and IP Transfer
Final assets are delivered in all required formats with full intellectual property ownership formally transferred to the commissioning organization. Files typically include: high-resolution TIFF for print, vector EPS or PDF for scalable use, optimized PNG for digital, and layered source files for future internal adaptation.
Common Mistakes Pharma Teams Make with Pharmaceutical Illustration
Avoiding these errors protects scientific credibility and prevents costly reprints, regulatory queries, and communication failures across your entire commercial program.
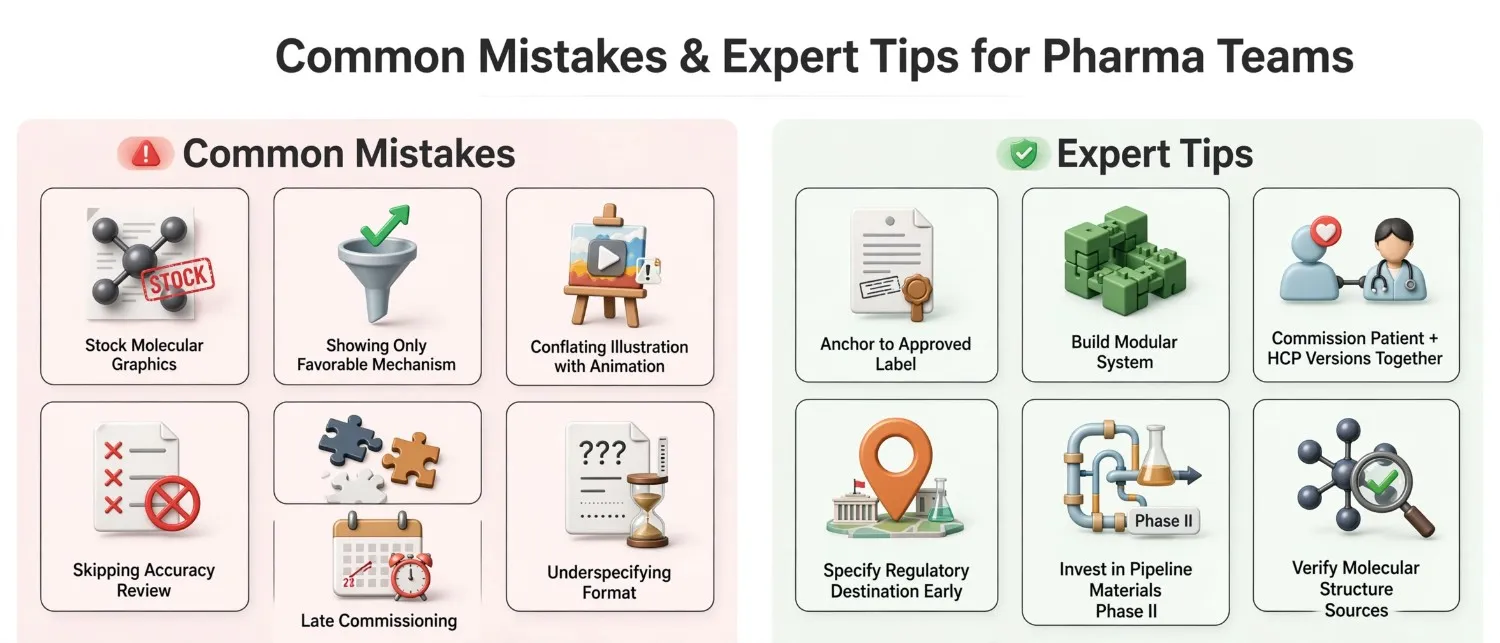
Using generic stock molecular graphics
Stock imagery of generic DNA helices, synapses, and cell membranes communicates nothing specific about your drug’s mechanism. It signals to sophisticated HCP and investor audiences that the science behind the product is not compelling enough to show accurately.
Showing only the favorable part of the mechanism
Illustrating only the efficacy pathway while omitting known off-target interactions or adverse effect mechanisms creates a misleading visual representation and constitutes a potential FDA promotional regulation violation.
Conflating illustration with animation
A multi-panel static MoA illustration and a 3D animated MoA video are distinct deliverables with different production workflows, timelines, and budgets. Understanding the full distinction between static pharmaceutical illustration and animated drug communication before commissioning prevents costly scope misalignment.
Skipping the scientific accuracy review
An illustration reviewed only by the marketing team and never seen by medical affairs is a liability. One pharmacologically incorrect receptor label or binding geometry can become a deficiency source in a regulatory review or a complaint source in a competitive challenge.
Using inconsistent visual conventions across materials
When different materials use different receptor shapes, color codes, and molecular scale conventions for the same drug, the cumulative communication effect is confusion rather than clarity. A cohesive pharmaceutical illustration system uses consistent visual language across all programs and materials.
Underspecifying the output format at the brief stage
A high-resolution TIFF for print is unusable in an interactive digital detail aid. A vector PDF is inappropriate for video integration. Always specify every intended medium and format before the first draft begins.
Commissioning illustration as a last step
The best pharmaceutical illustration programs begin during Phase II, when there is enough clinical data to ground the mechanism visually but enough time to refine the illustration before Phase III readout presentations and pre-launch regulatory submissions.
Expert Tips for Pharma Medical Affairs and Marketing Teams
These recommendations reflect the specific operational needs of pharma teams commissioning pharmaceutical illustration across multiple programs and therapeutic areas.
Anchor every illustration to the approved label
The approved Prescribing Information (PI) or SmPC is the primary scientific reference for any commercially deployed pharmaceutical illustration. If an interaction or claim is not described in the approved label, it should not appear in a promotional illustration.
Build a modular illustration system
Rather than commissioning one-off illustrations for each project, design a modular visual system: core molecular components (receptor structure, drug molecule, signaling proteins) built as reusable layered assets that can be reconfigured for different audience levels and material types without requiring a full re-illustration.
Commission the patient illustration alongside the HCP illustration
The best time to produce the patient-facing version of a pharmaceutical illustration is simultaneously with the HCP version, while the scientific brief is current and the illustrator has full mechanistic context. Commissioning them separately months apart consistently introduces scientific inconsistency.
Specify your regulatory destination at the brief stage
FDA promotional regulations differ from EMA requirements, which differ from PMDA guidelines. An illustration built for an FDA-regulated US detail aid may require structural modification for EU deployment. Your illustrator needs to know every regulatory market the asset will enter before beginning development.
Invest in high-science pipeline materials early
The most effective MoA illustrations for early-phase pipeline assets are commissioned during Phase II. This timing allows enough clinical and mechanistic data to ground the illustration accurately, while leaving enough time before Phase III data readout and investor presentations to refine the visual through proper review cycles.
Verify molecular structure sources explicitly in the brief
Provide RCSB Protein Data Bank entry numbers, published crystal structure references, or company-proprietary molecular geometry files wherever available. This single step eliminates the most common root cause of scientific inaccuracy in pharmaceutical illustration.
For teams developing pharmaceutical illustration specifically for clinical training contexts, the detailed guide to pharma training programs that integrate medical illustrations into educational content outlines the production considerations unique to that format and audience.
Pharmaceutical Illustration vs. Medical Animation: Choosing the Right Format
Comparison Table: Static Illustration vs. MoA Animation
| Criteria | Pharmaceutical Illustration (Static) | Medical / MoA Animation (Video) |
|---|---|---|
| Production timeline | 1–4 weeks per panel set | 4–12 weeks minimum |
| Budget | Lower; suitable for most program budgets | Higher; requires substantial investment |
| Use in print materials | Yes: detail aids, publications, slides, posters | No: video format only |
| MLR review complexity | Standard visual-only review | Requires review of visual and audio script |
| Audience engagement (digital) | High for infographic-native formats | Highest for complex dynamic processes |
| Audience engagement (print/conference) | Optimal for booth graphics, handouts, posters | Requires screen or projector infrastructure |
| Modification flexibility | High: layers update per audience or region | Low: re-animation required for substantive changes |
| Appropriate for journal publications | Yes: fully compatible with all journal standards | No: static journals require static figures |
| Appropriate for regulatory submission | Yes: supports NDA/BLA/IND documentation | Limited: supplementary use only |
| Best application | All print and static digital MoA communication | Complex dynamic processes, conference presentations |
Frequently Asked Questions About Pharmaceutical Illustration
What is pharmaceutical illustration?
Pharmaceutical illustration is a specialized discipline of biomedical visual communication that produces scientifically accurate visual representations of drug mechanisms, molecular pharmacology, biological pathways, pharmacokinetics, drug delivery systems, and dosage form architecture. These illustrations are used across pharmaceutical marketing materials, clinical education programs, regulatory submissions, scientific publications, investor presentations, and patient-facing communication.
How is pharmaceutical illustration different from general medical illustration?
General medical illustration covers the full range of biomedical visualization, including human anatomy, surgical procedures, and healthcare equipment. Pharmaceutical illustration is a specialized subset focused specifically on pharmacology: the molecular, cellular, and systemic behavior of drugs and biological therapeutics. It requires deeper engagement with molecular biology, pharmacology literature, and the specific regulatory requirements governing pharmaceutical promotion and product labeling.
What does a mechanism-of-action illustration show?
A mechanism-of-action (MoA) pharmaceutical illustration shows precisely how a drug interacts with its molecular target and what biological consequences follow from that interaction. Depending on the drug class, this may include: receptor binding and activation, enzyme inhibition, ion channel blockade, monoclonal antibody-epitope engagement, intracellular signaling cascade modulation, or gene expression regulation at the transcriptional or translational level.
Can pharmaceutical illustrations be used in FDA submissions?
Yes. Pharmaceutical illustrations are used in New Drug Applications (NDAs), Biologics License Applications (BLAs), Abbreviated New Drug Applications (ANDAs), and Investigational New Drug (IND) applications to visually document drug mechanisms, formulation architecture, and route-of-administration. They must accurately represent the drug’s pharmacology as established in the clinical data package and must not overstate efficacy or omit material safety information.
How long does a pharmaceutical illustration take to produce?
Timeline depends on the illustration type and complexity. A single-panel MoA diagram typically requires 5-10 business days. A multi-panel sequential MoA infographic covering drug target engagement through therapeutic effect typically requires 2-3 weeks. A comprehensive pharmaceutical illustration package covering multiple audience levels and delivery formats can take 4-8 weeks, depending on the number of scientific and regulatory review cycles required.
What source materials does a pharmaceutical illustrator need?
Core reference materials include: published pharmacology papers for the compound, the approved PI or SmPC for commercially approved drugs, the investigator’s brochure for clinical-stage compounds, molecular structure data (PDB entries or company-supplied geometry files), and the company’s approved brand guidelines. The more complete the reference package provided at brief stage, the faster and more accurate the first draft will be.
What is the difference between a pharmaceutical illustration and an MoA animation?
A pharmaceutical illustration is a static or sequential-panel visual that can be reproduced in print, digital, and regulatory formats across all media types. A mechanism-of-action animation is a video format depicting the drug mechanism through motion over time. Both communicate MoA effectively, but they serve different media contexts, carry different production timelines and costs, and require different review processes. For a comprehensive treatment of this distinction, see the full breakdown of how medical illustration and animation differ from each other.
Pharmaceutical Illustration is the Foundation of Drug Communication Strategy
The pharmaceutical industry communicates science that is, by its nature, invisible to the naked eye. Drug-receptor binding happens at nanometer scales. Intracellular signaling cascades unfold within microseconds. Pharmacokinetic distribution plays out across hours within organs and tissues that no audience will ever directly observe. Pharmaceutical illustration makes all of it visible – and therefore comprehensible, credible, and commercially actionable.
For pharma and biotech organizations, pharmaceutical illustration is not a marketing embellishment. It is the mechanism by which complex drug science reaches the HCPs who prescribe it, the regulators who review it, the investors who fund it, and the patients who depend on it. The quality, scientific accuracy, and audience calibration of that illustration directly determine how effectively each of those communication goals is achieved.
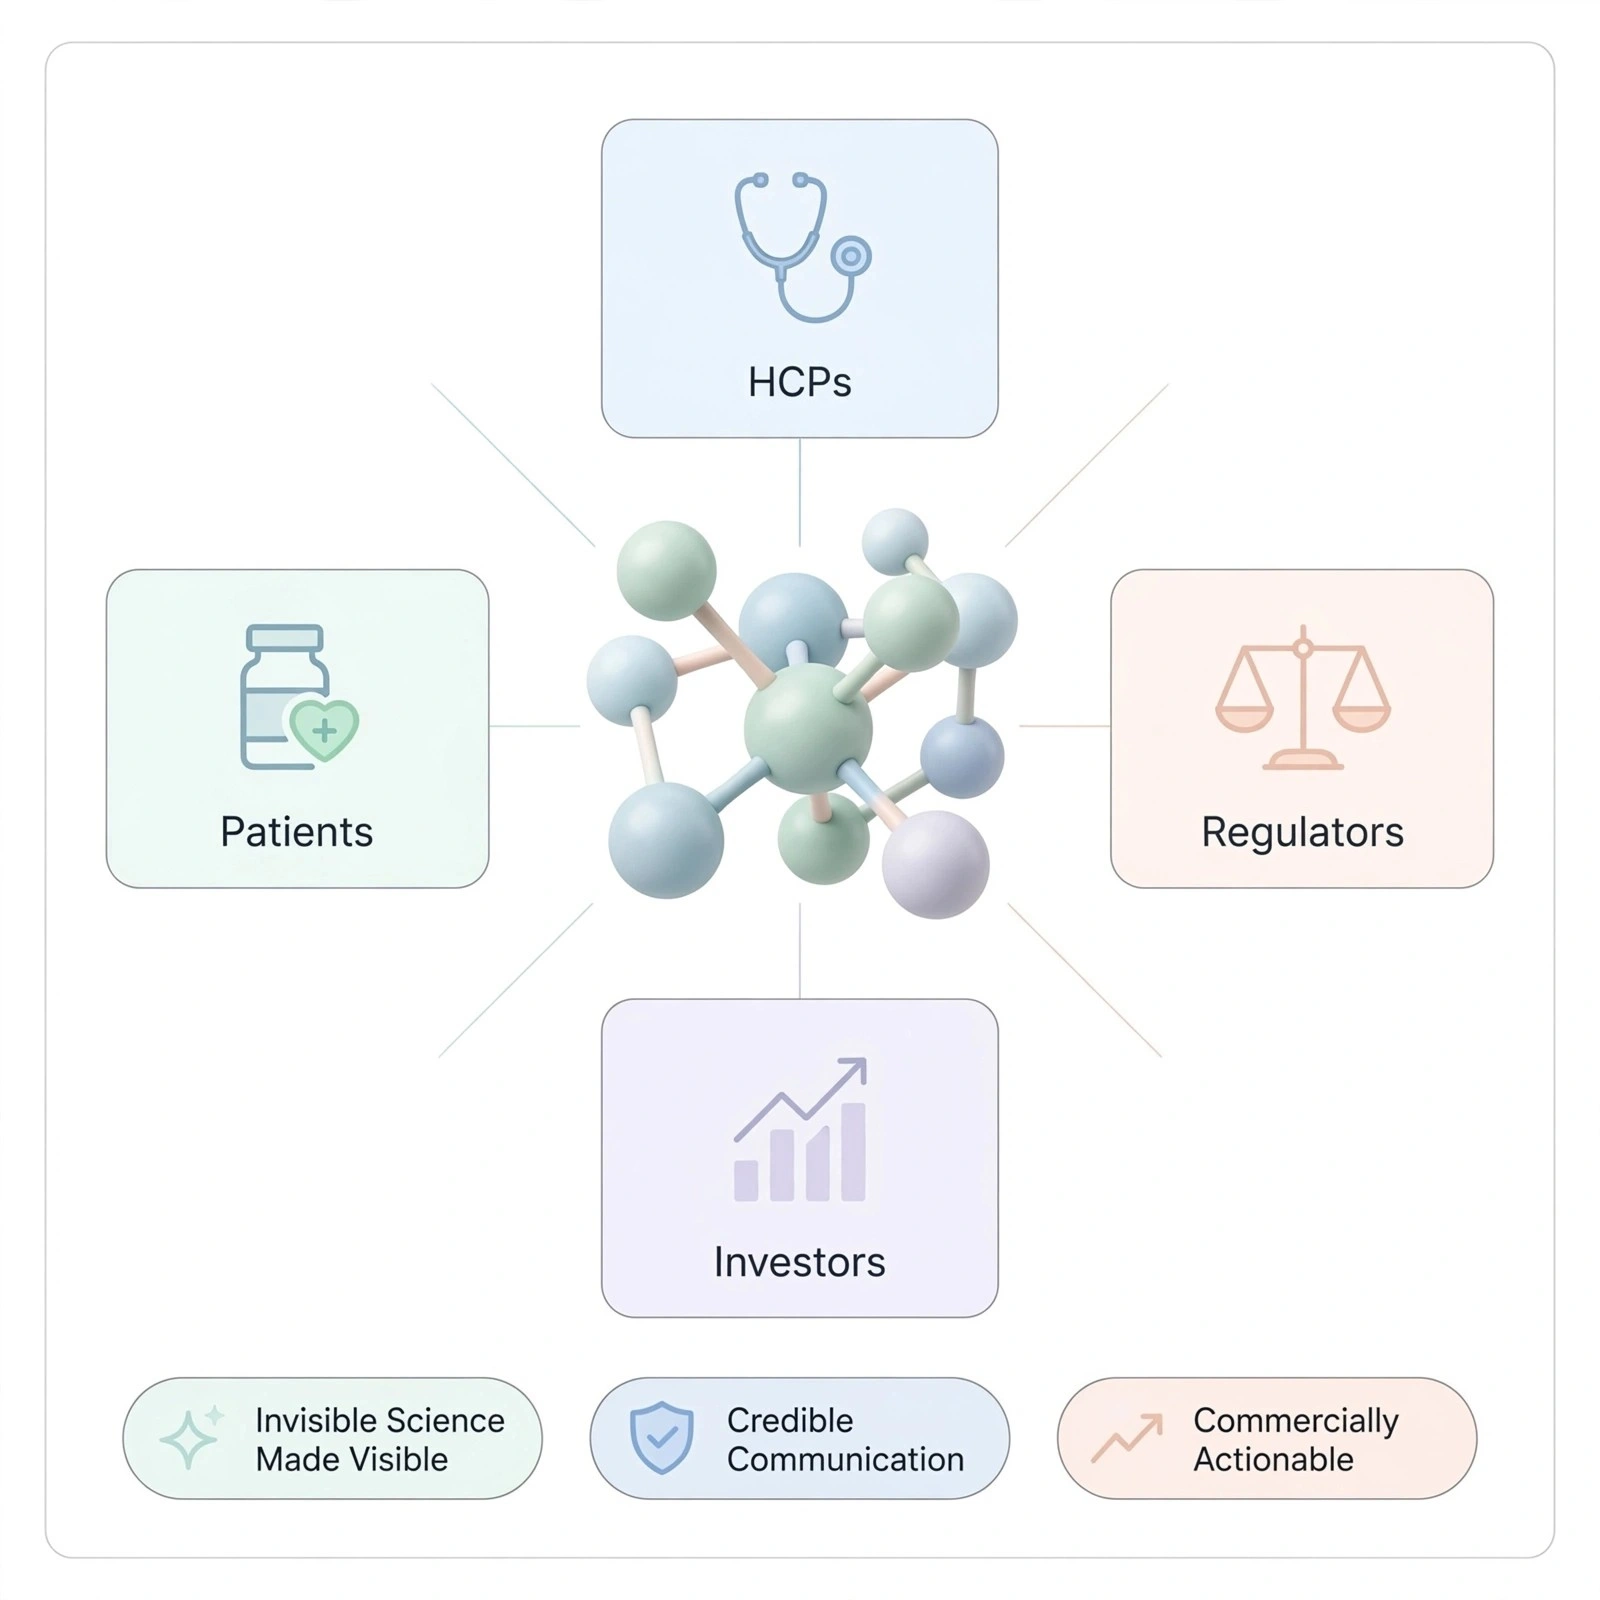
Teams that treat pharmaceutical illustration as a core scientific communication investment – rather than a final-stage visual polish exercise – consistently produce stronger regulatory submissions, more compelling investor materials, higher-quality HCP education programs, and more adherent patient populations.
receive scientifically validated, revision-unlimited, audience-calibrated pharmaceutical visuals delivered at competitive rates, with full intellectual property ownership on delivery.