Scientific illustration images play a crucial role in research papers by visually communicating complex concepts, data, and processes to readers. Here are some types of scientific illustration images that are commonly used in research papers:
Different Types of Scientific Illustration Images for Research Papers
- Graphs and Charts:
- Line graphs, bar charts, scatter plots, and pie charts are used to represent quantitative data and relationships.
- X-Y plots are often used to show trends, correlations, and comparisons between variables.
- Diagrams and Schematics:
- Flowcharts, process diagrams, and schematics are used to illustrate the steps of a procedure, a biological pathway, or a physical process.
- Structural diagrams show the arrangement and relationships of components in a system.
- Molecular and Cellular Illustrations:
- Molecular structures of compounds, proteins, DNA, and other molecules can be depicted to convey their shapes and interactions.
- Cellular illustrations can show organelles, cell structures, and their functions.
- Anatomical Illustrations:
- Anatomical diagrams are used to illustrate the structure of organisms, tissues, and organs.
- Cross-sectional illustrations provide insights into internal structures.
- Maps and Geographic Information:
- Geographic maps, GIS visualizations, and geological diagrams are used in earth sciences and environmental studies.
- Microscopic Images:
- Micrographs captured through microscopy techniques such as light microscopy, electron microscopy, and confocal microscopy show the microscale details of samples.
- Evolutionary Trees and Phylogenetic Trees:
- Phylogenetic trees illustrate the evolutionary relationships among species or organisms.
- Illustrations of Instruments and Equipment:
- Illustrations of experimental setups and lab equipment help readers understand the methods used in the study.
- Models and 3D Renderings:
- 3D models and renderings help visualize complex structures or systems from different angles.
- Genetic and Genomic Maps:
- Genetic and genomic maps illustrate the positions of genes, markers, and other elements on chromosomes.
- Mathematical Equations and Formulas:
- Equations and formulas can be presented in mathematical notation to explain the theoretical aspects of the research.
- Time Series Plots:
- Time-dependent data can be effectively presented using line graphs or other plots to show trends and patterns.
When creating scientific illustration images for research papers, it’s important to ensure they are accurate, clear, and labeled appropriately. Proper citation and credits should be given for any images that are not original. Additionally, using specialized software such as Adobe Illustrator, Inkscape, or BioRender can help you create high-quality and precise scientific illustrations.
Preferred Software for Scientific Illustration Images for Research Publications
There are several software options available for creating scientific illustration images, each with its own strengths and features. Here are five top software choices for scientific illustration:
Adobe Illustrator
Using Adobe Illustrator for creating scientific illustration images offers several benefits that make it a popular choice among researchers and scientists. Here are some of the key advantages:
- Vector Graphics: Illustrator uses vector graphics, which means that images are created using mathematical formulas to define lines, shapes, and curves. This results in images that are infinitely scalable without any loss of quality, making it perfect for creating illustrations that need to be resized for different purposes.
- Precision and Accuracy: Illustrator provides precise control over shapes, lines, and colors. This is essential for scientific illustrations where accuracy is paramount. You can align objects perfectly, snap to grids, and ensure that your illustrations adhere to accurate measurements.
- Customization: Illustrator offers a wide range of tools and options that allow you to customize your illustrations to match your specific needs. You can create intricate diagrams, annotate components, and adjust details to convey complex concepts effectively.
- Variety of Tools: Illustrator provides a diverse set of tools for creating different types of scientific illustrations, from molecular structures and anatomical diagrams to graphs and charts. These tools include pen tools, shape tools, text tools, and more.
- Layers and Organization: Illustrator allows you to work with layers, which is particularly useful for complex illustrations. You can separate different elements of your illustration onto separate layers, making it easier to manage and edit individual components.
- Library of Symbols and Shapes: Illustrator offers a wide range of built-in symbols, shapes, and icons that can be useful for scientific illustration. You can also create your own libraries of frequently used symbols for faster illustration.
- Integration with Other Adobe Products: If you’re creating a scientific publication that includes both text and illustrations, Illustrator can easily integrate with other Adobe products like InDesign and Photoshop. This streamlines the workflow and ensures consistency in your final publication.
- Export Formats: Illustrator allows you to export your illustrations in various formats, including high-resolution raster images (such as JPEG or PNG), vector formats (such as SVG or PDF), and even interactive formats like SVG with animation.
- Precise Typography: If your scientific illustration involves textual annotations or labels, Illustrator’s typography tools allow you to control font styles, sizes, and alignment with precision.
- Professional Output: Illustrator produces high-quality output suitable for publication in research papers, presentations, posters, and more. Its precise rendering ensures that your illustrations will look sharp and clear in various media.
- Tutorials and Community: There are plenty of online tutorials, resources, and a supportive community of users who can help you learn and master Adobe Illustrator for scientific illustration.
While Illustrator offers many advantages, it’s important to note that there is a learning curve, especially if you’re new to the software. However, the time invested in learning Illustrator can pay off by allowing you to create polished and accurate scientific illustrations that effectively communicate your research findings.
Adobe Photoshop
While Adobe Photoshop is primarily known for its photo editing capabilities, it can also be used for creating certain types of scientific illustration images. Here are some benefits of using Adobe Photoshop for creating scientific illustration images:
- Image Editing and Enhancement: Photoshop excels at editing and enhancing images, making it suitable for scientific images that require adjustments to contrast, brightness, color balance, and more. You can optimize and refine images captured from microscopy, imaging, or other sources.
- Raster Graphics Flexibility: Unlike vector-based software, Photoshop works with raster graphics (pixels). This can be advantageous for illustrations that involve detailed textures, shading, and image-based effects.
- Layered Composition: Photoshop allows you to work with layers, making it possible to overlay, mask, and blend different elements in your illustration. This is useful for creating composite images or combining various components.
- Annotations and Labels: You can add textual annotations, labels, and descriptions directly onto images in Photoshop. This is useful for labeling parts of a biological specimen, indicating measurements, or explaining features.
- Scientific Imaging Processing: For scientific images like gel electrophoresis results, spectra, or chromatograms, Photoshop can help enhance clarity, adjust levels, and annotate peaks or bands.
- Merging Multiple Images: Photoshop’s layering and blending capabilities allow you to merge multiple images into a single illustration. This is helpful for creating images that compare different conditions or stages.
- Custom Brushes and Effects: You can create custom brushes and apply various effects to achieve specific visual results. This can be useful for depicting certain types of textures, patterns, or effects in scientific images.
- Visualization of Data Overlays: If you have data to overlay onto images, Photoshop can help create visualizations by merging the image with data layers, such as heatmaps or contour plots.
- 3D Imaging: Photoshop includes limited 3D capabilities, allowing you to create and manipulate basic 3D models. This can be useful for visualizing molecular structures or other 3D concepts.
- Precise Selections: Photoshop provides powerful selection tools that allow you to isolate specific parts of an image for editing or illustration purposes.
- Integration with Other Adobe Products: If your scientific illustration involves combining imagery with text or layouts, Photoshop can seamlessly integrate with other Adobe products like Illustrator and InDesign.
- Retouching and Cloning: Photoshop’s retouching tools can be useful for removing noise, artifacts, or unwanted elements from images.
It’s important to note that while Photoshop offers these benefits, it may not be the best choice for creating certain types of scientific illustrations, such as precise diagrams or vector-based graphics. The choice between Photoshop and other software like Adobe Illustrator or specialized scientific illustration tools depends on the nature of your illustrations, your familiarity with the software, and the desired final output.
Our Services:
The Medical Illustration Company is a professional medical illustration company providing services for clients from all over the world. The Medical Illustration Company works with clients in all sectors of healthcare, from private practice to industry and academia, with a special focus on the scientific, biological, pharmaceutical, and cosmetics sectors. Our clients are involved in the development of new drugs, scientific research, biochemical research, vaccines, and medical devices; in the approval process for these products or new procedures; and can include everything from large multinational corporations to small start-ups.
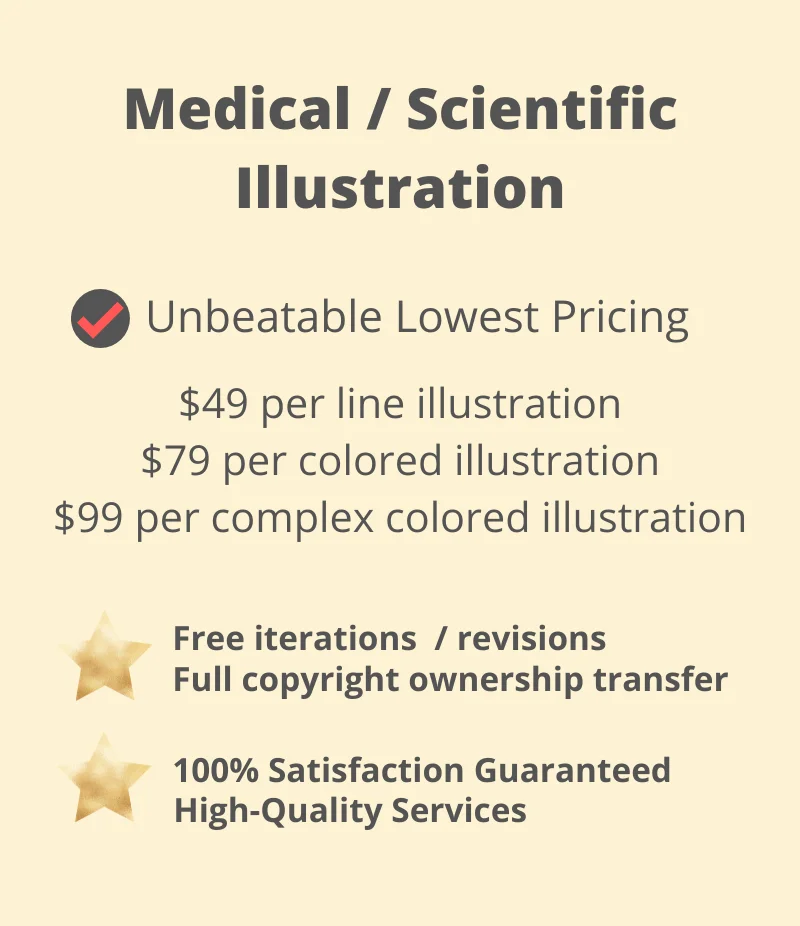
Medical Illustration Price Cost (Unbeatable Lowest Pricing)
- $49 per line illustration (simple illustration in black and white drawing. Including one organ, instrument or person). Free iterations + Full copyright ownership transfer included.
- $79 per colored illustration (standard difficulty illustration in color. Including one organ, instrument or person). Free iterations + Full copyright ownership transfer included.
- $99 per complex colored illustration (colored, illustration including shading. (Including one system, procedure, etc). Free iterations + Full copyright ownership transfer included.
Submit Your Project Now: Looking for Medical Illustration Services?