
Biotechnology illustration is a specialized discipline of scientific visual communication that produces molecularly precise, biologically accurate graphic representations of living systems, genetic processes, cellular mechanisms, biomanufacturing workflows, and therapeutic modalities – spanning gene editing, cell therapy, mRNA technology, antibody engineering, and synthetic biology – for use across biotech R&D documentation, investor presentations, regulatory submissions, scientific publications, and commercial communication. It encompasses the full spectrum of biological scale: from atomic-level protein crystallography renders and CRISPR-Cas9 editing complex diagrams to whole-organism physiological pathway overviews and large-scale bioreactor process flow illustrations. For any organization operating within the global biotechnology market – projected to expand from $2.15 trillion in 2025 toward $4.41 trillion by 2031 – biotechnology illustration is the primary mechanism by which invisible biological science becomes fundable, publishable, and commercially actionable.
Modern biotechnology operates at scales and speeds that make verbal description fundamentally insufficient. Gene editing events unfold within angstroms. Cell signaling cascades complete within milliseconds. Biomanufacturing processes span weeks of precisely orchestrated biological and engineering steps. Biotechnology illustration translates all of it into visuals that scientific peers, regulatory reviewers, clinical investigators, investors, and patients can act on.
This guide covers what biotechnology illustration is, why the biotech sector depends on it, the full range of illustration types available, how the production process works, and what separates exceptional biotech visual communication from generic molecular stock graphics.
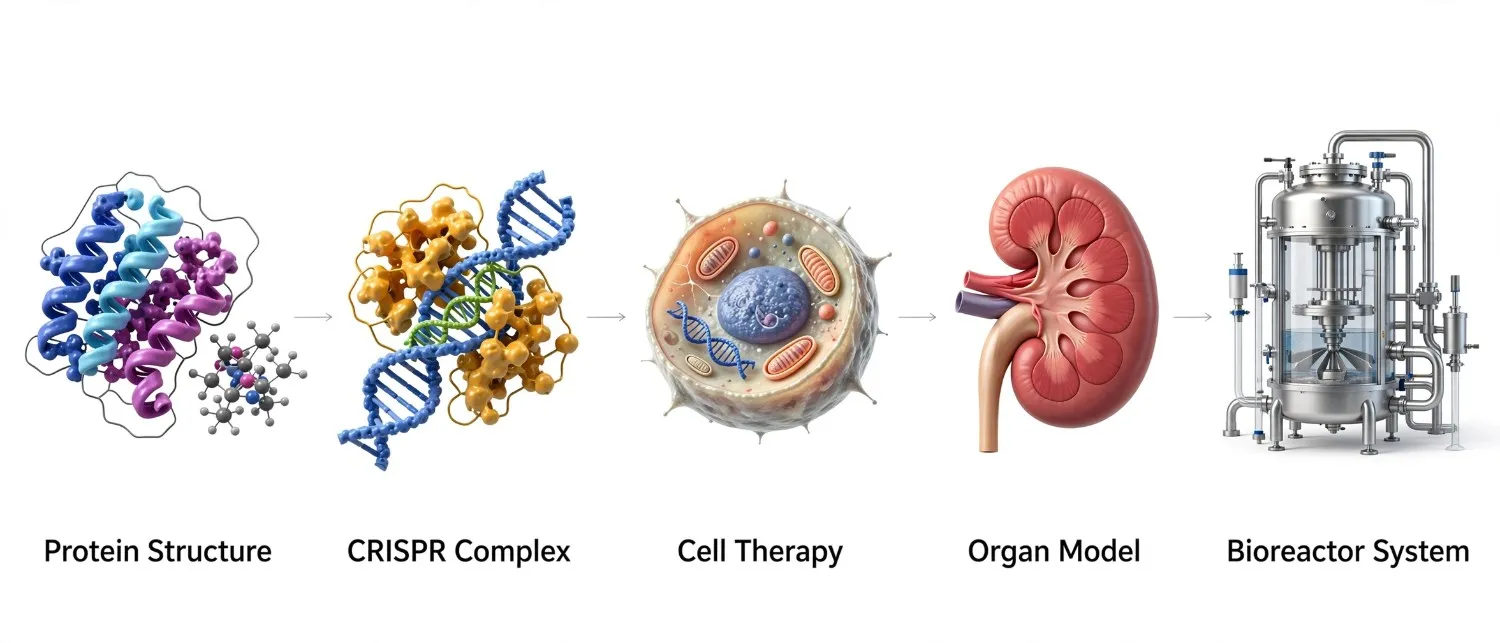
For life sciences organizations that require custom biotechnology illustration and scientific visualization services built on graduate-level biomedical training and peer-reviewed source accuracy, The Medical Illustration Company delivers studio-quality assets with unlimited revisions and full copyright ownership transfer.
What is Biotechnology Illustration? A Precise Definition
Biotechnology illustration is the practice of creating scientifically accurate, purposefully designed visual representations of biological systems and biotechnological processes. The field draws on molecular biology, cell biology, genetics, biochemistry, bioprocess engineering, and biomedical visualization training in equal measure.
Three defining characteristics set biotechnology illustration apart from general scientific graphics:
Biological system accuracy
Every depicted cellular structure, molecular complex, genetic sequence interaction, or bioprocess step must reflect the current state of peer-reviewed biological science, not a schematic approximation or artistic interpretation.
Process and mechanism specificity
Unlike anatomical medical illustration, biotechnology illustration frequently depicts dynamic processes: gene integration, protein folding, viral vector transduction, immune cell engineering, or fermentation cascade sequences. The illustration must communicate the process accurately, not merely the structure.
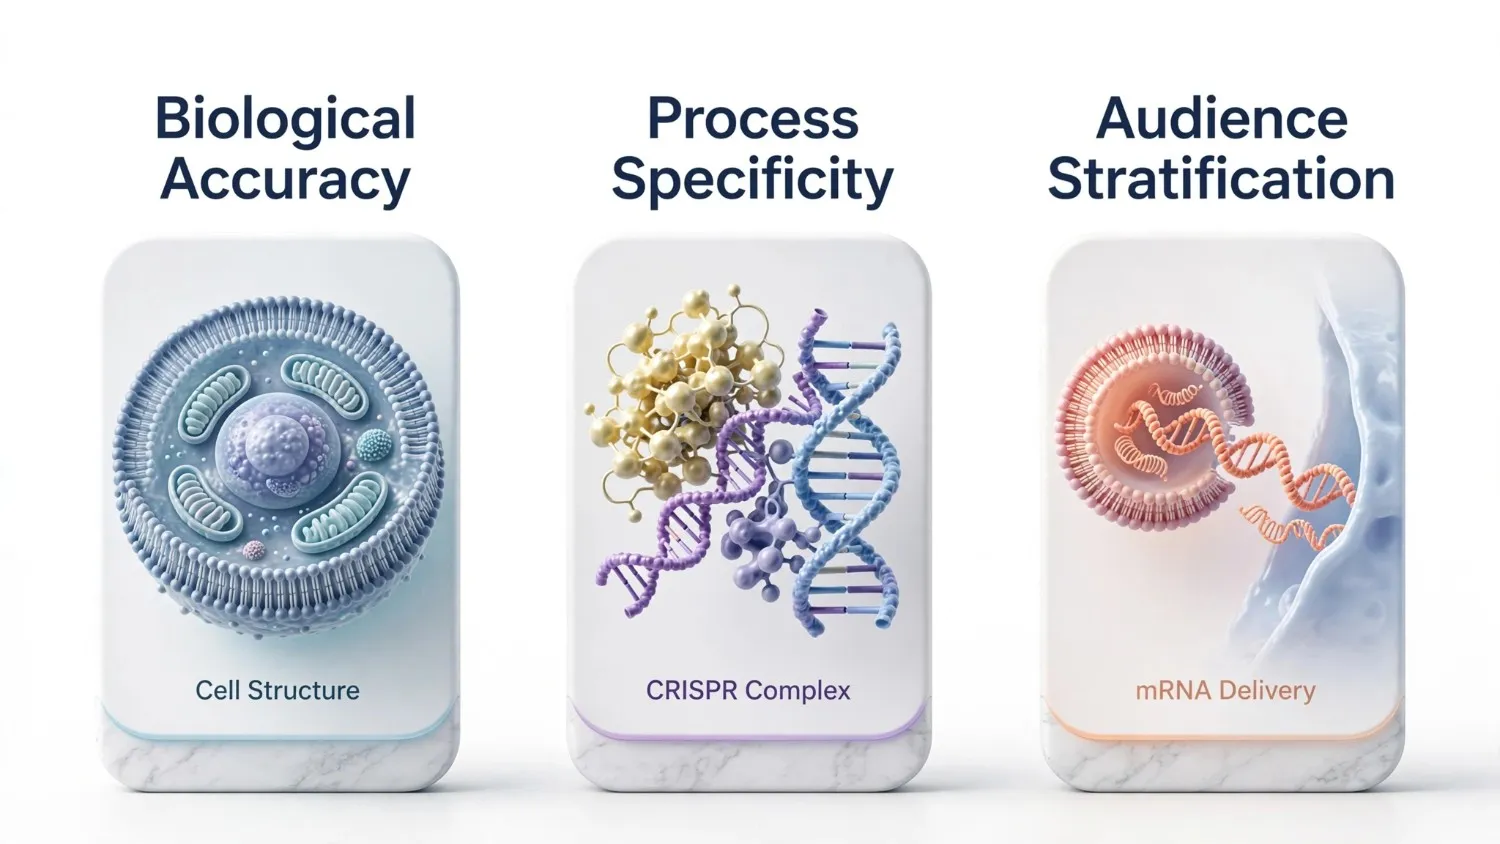
Audience stratification
The same CRISPR gene editing mechanism must be communicated differently to a molecular biologist writing a Nature publication, a venture capital partner evaluating a Series B, a regulatory affairs team preparing an IND submission, and a patient about to receive a gene therapy infusion.
Quick Answer for Featured Snippets: Biotechnology illustration is the creation of scientifically accurate visual representations of biological systems, genetic processes, cell mechanisms, biomanufacturing workflows, and therapeutic modalities. It is used in biotech investor presentations, regulatory submissions, scientific publications, patent applications, and clinical communication programs.
Why Biotechnology Companies Need Visual Communication
The global biotechnology industry does not just produce complex science. It produces science that is, almost without exception, invisible to the naked eye. According to Mordor Intelligence, the global biotechnology market is projected to grow from $2.15 trillion in 2025 to $4.41 trillion by 2031 at a CAGR of 12.67%. Within this environment, every organization competing for funding, regulatory approval, publication space, and clinical adoption faces the same core challenge: communicating biological science that exists at scales no human can directly observe.
Biotechnology illustration addresses this challenge across every stakeholder audience.
Investors Cannot Fund What They Cannot Visualize
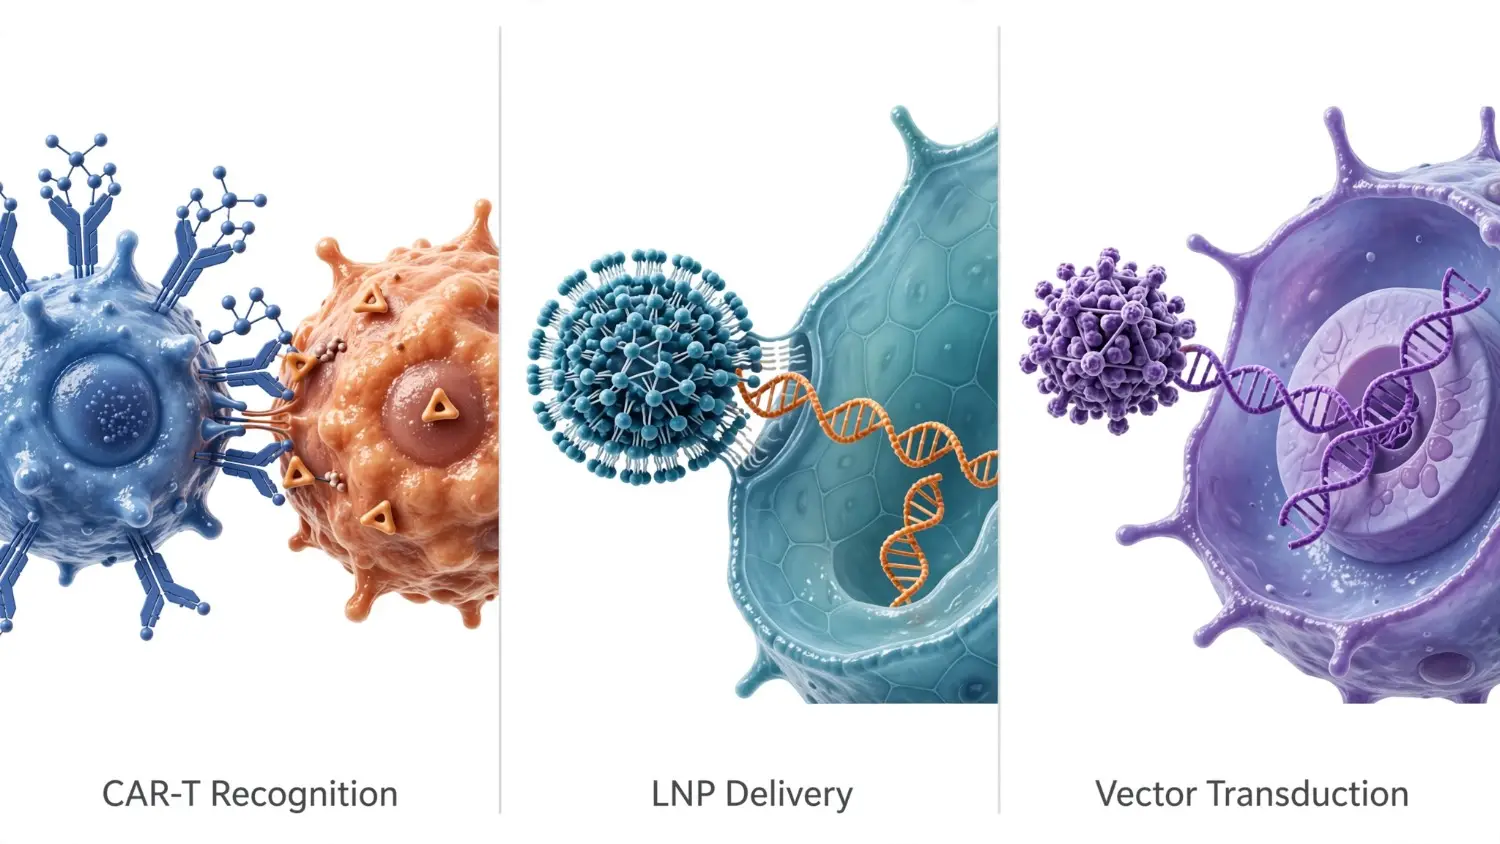
Biotech investment decisions require non-specialist audiences to understand extraordinarily complex mechanisms: how a CAR-T cell is engineered to recognize and destroy a tumour cell, why a lipid nanoparticle successfully delivers an mRNA payload to hepatocytes, or how a viral vector achieves tissue-specific transduction without triggering an immune response.
A well-executed biotechnology illustration communicates this science in a single panel. It converts mechanistic complexity into investable propositions – and according to life sciences communication specialists, it directly reduces the time investors spend on scientific comprehension and increases the time they spend evaluating commercial opportunity.
Regulatory Reviewers Need to See the Mechanism
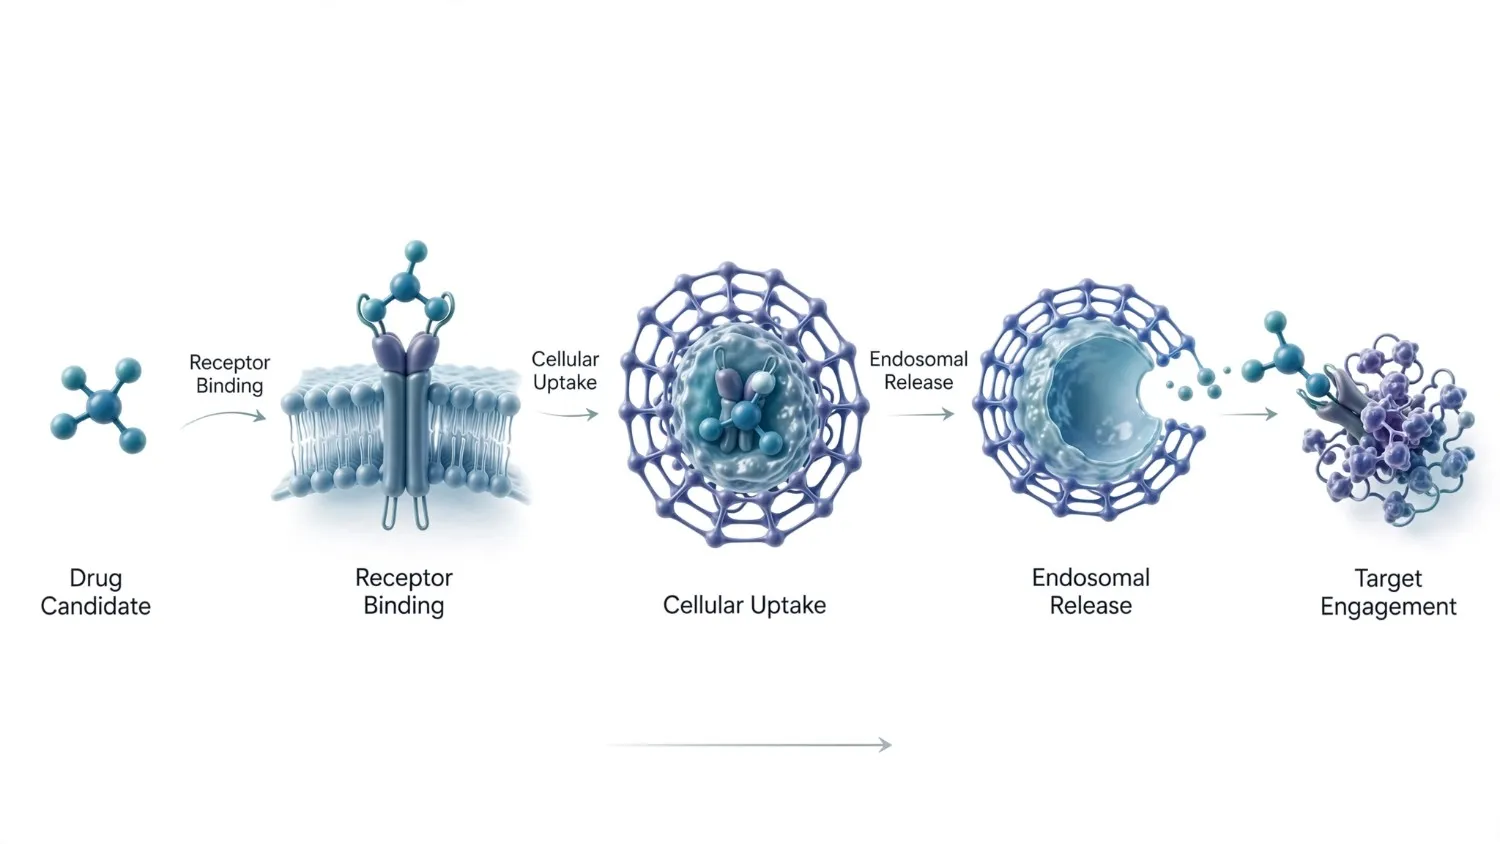
FDA, EMA, and other regulatory bodies reviewing IND applications, BLA submissions, and gene therapy dossiers must understand the proposed mechanism of action at the molecular and cellular level. Well-constructed biotechnology illustration in a submission package gives reviewers visual anchors for complex biological claims, reduces the need for clarification requests, and demonstrates the scientific rigor of the applicant organization.
Scientists Communicate Better With Visuals Than Text Alone
Peer-reviewed publications in high-impact journals including Nature, Cell, and Science consistently require authors to submit graphical abstracts and conceptual figures that summarize key findings visually. Editors and peer reviewers use these figures to assess whether the science is worth a full read.
As NIH-published research on scientific illustration and the role of visual models confirms, creating accurate visual models of biological hypotheses is fundamental to both generating new ideas and communicating findings to the scientific community and the public.
Clinical Teams and Patients Benefit from Biological Clarity
Gene and cell therapy patients are frequently receiving treatments of extraordinary molecular complexity – and they must provide informed consent for those treatments. A clear, patient-calibrated biotechnology illustration explaining how a viral vector delivers a corrective gene, or how a modified T cell locates and kills a tumour, directly improves informed consent quality, reduces anxiety, and supports treatment adherence.
For a foundational overview of how visual communication underpins all healthcare and life sciences outcomes, the article on why medical illustrations matter across clinical and commercial contexts provides essential background reading.
Types of Biotechnology Illustration
The scope of biotechnology illustration is broad. Each category serves a distinct scientific domain, communication purpose, and audience type.
Gene Editing and Gene Therapy Illustration
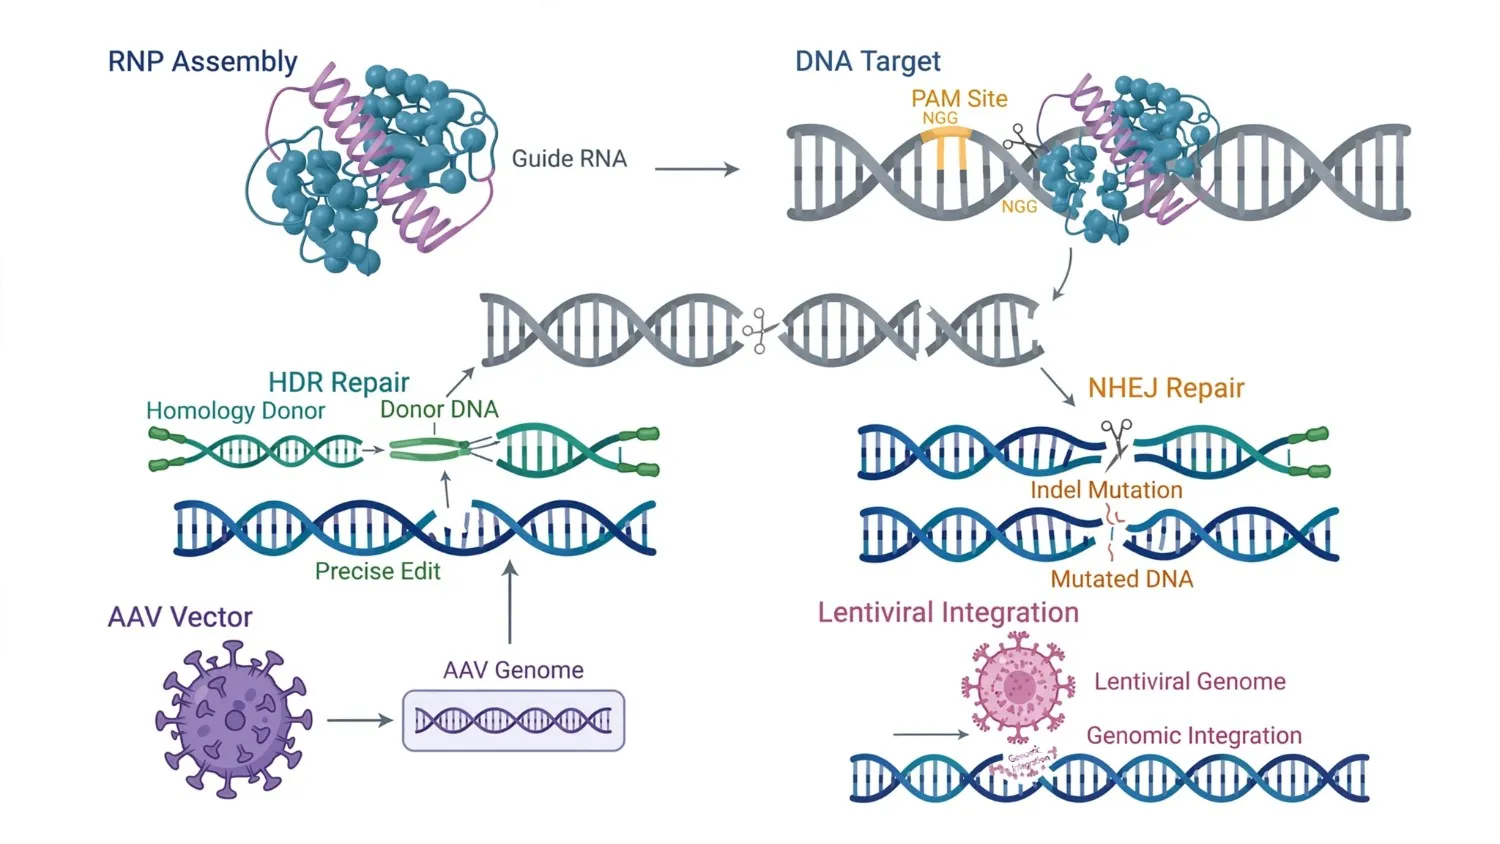
The fastest-growing segment of biotechnology illustration, driven by the rapid clinical advancement of CRISPR-Cas9, base editing, prime editing, and viral vector gene therapy. As of Q3 2024, 32 gene therapies and 34 RNA therapies had already received regulatory approval, with hundreds more in active clinical development.
Gene editing illustrations depict: CRISPR-Cas9 ribonucleoprotein complex assembly and target recognition, guide RNA design and strand specificity, double-strand break repair pathways (HDR vs. NHEJ), adeno-associated virus (AAV) vector genome structure and cell transduction, lentiviral vector integration dynamics, and in vivo delivery system biodistribution.
Cell Therapy Illustration
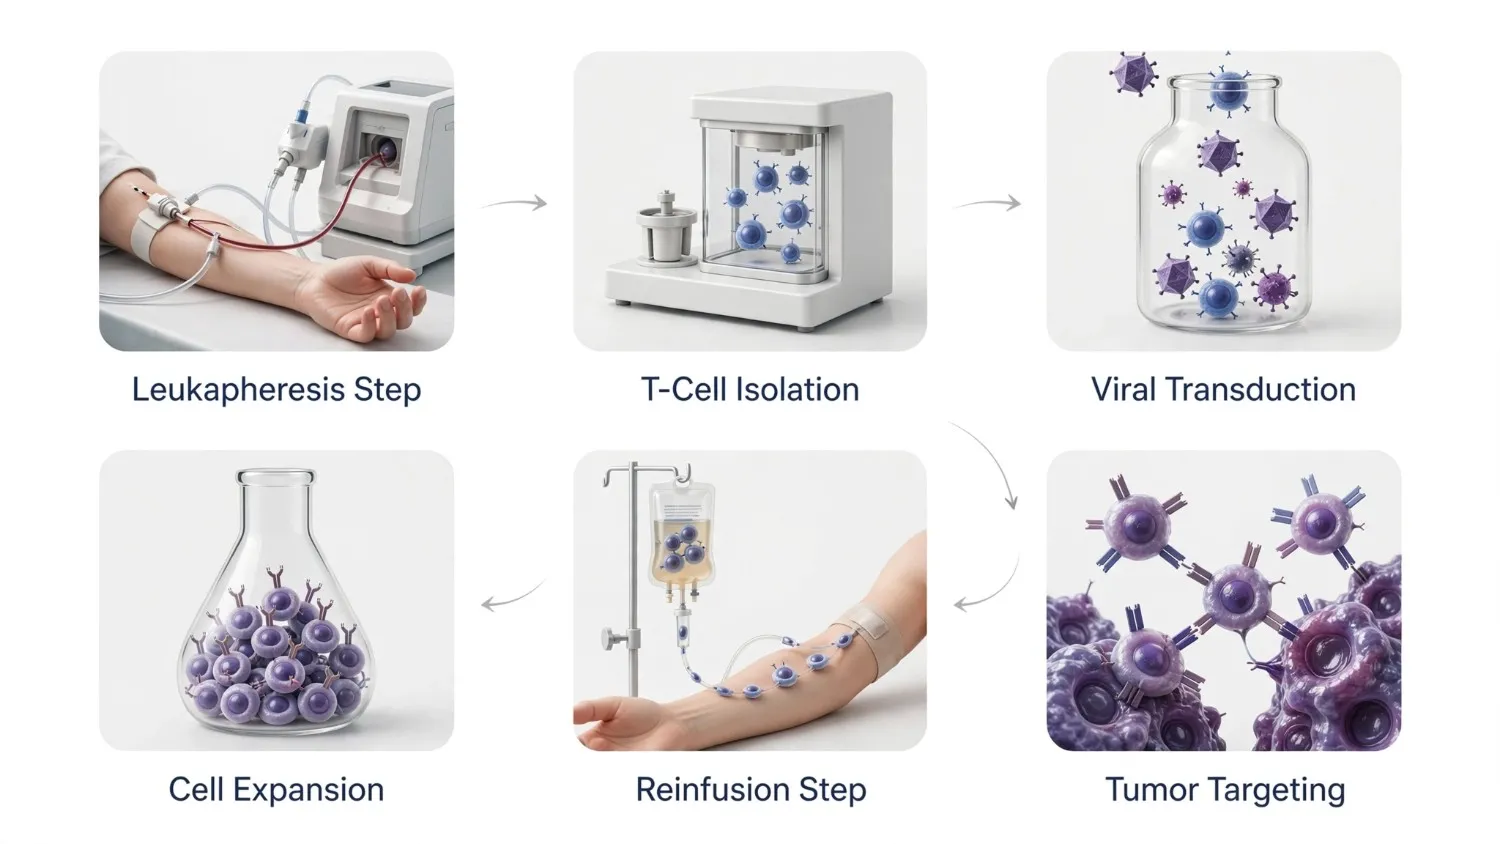
Cell therapy visualization covers: CAR-T cell engineering workflows (leukapheresis, viral transduction, ex vivo expansion, re-infusion), natural killer (NK) cell activation and tumour targeting, stem cell differentiation pathways, iPSC-derived therapeutic cell production processes, and tumour-infiltrating lymphocyte (TIL) isolation and expansion. These illustrations are essential for clinical investigator briefings, regulatory module documentation, and patient education programs.
Molecular Biology and Protein Engineering Illustration
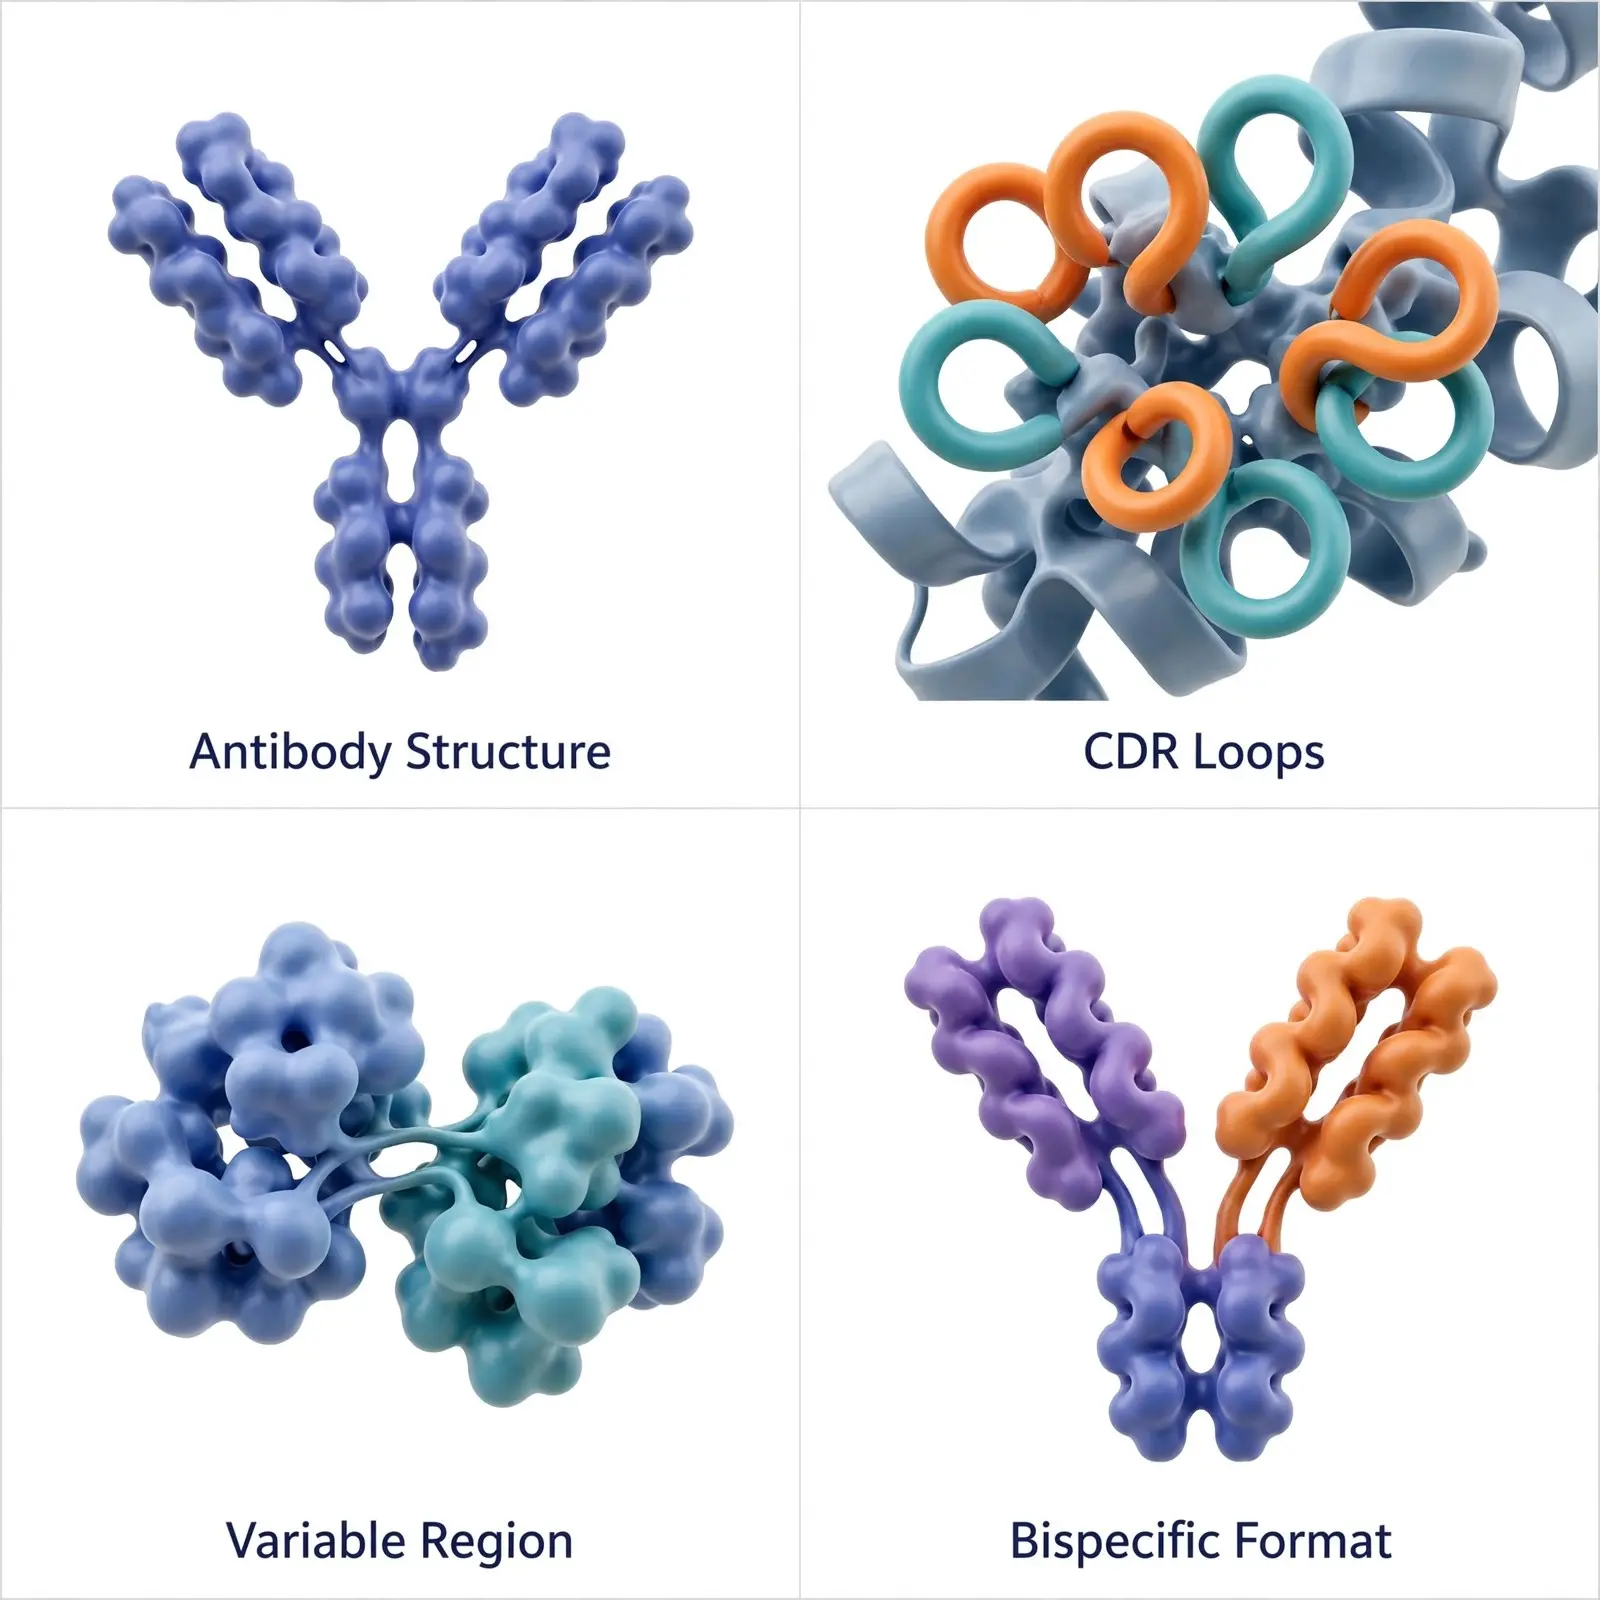
At the molecular level, biotechnology illustration encompasses a broad range of highly detailed scientific visualizations that communicate complex biological structures, molecular interactions, and cellular mechanisms with clarity and precision. These include antibody structure and engineering (variable region, CDR loops, and bispecific antibody format visualization), protein–protein interaction network diagrams, enzyme kinetics and allosteric regulation schematics, signal transduction pathway mapping, transcription factor binding and gene regulatory network illustrations, as well as mRNA structure and translation mechanism diagrams. Together, these illustrations help researchers, educators, biotechnology companies, and pharmaceutical organizations accurately communicate molecular concepts for scientific research, drug discovery, therapeutic development, and advanced biomedical applications.
mRNA and Nucleic Acid Therapeutics Illustration
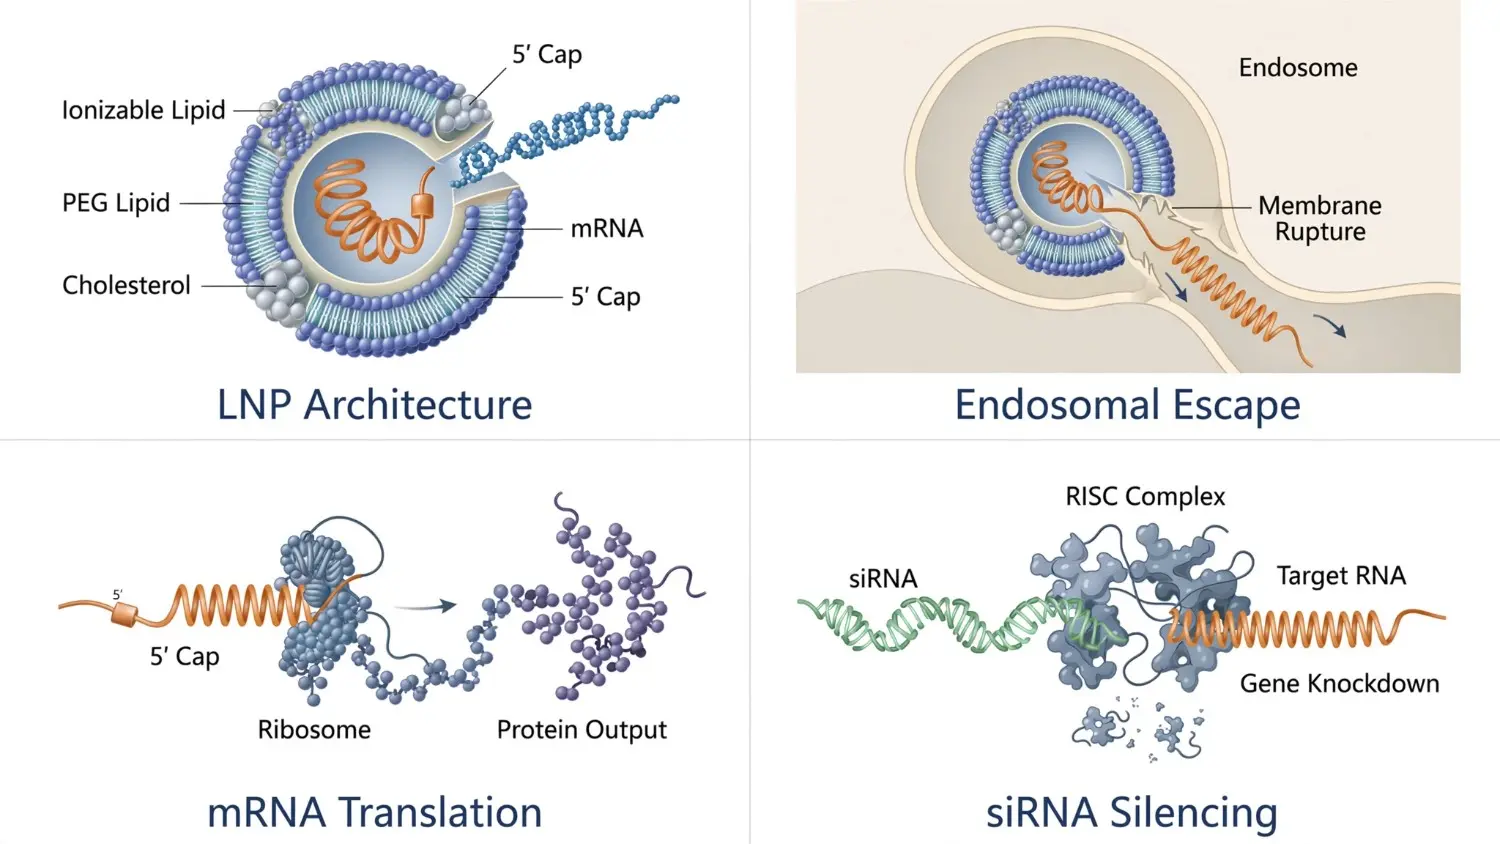
The commercial validation of mRNA therapeutics by the COVID-19 vaccine programs created significant demand for high-quality visual communication in this area. mRNA illustration covers: lipid nanoparticle (LNP) architecture and endosomal escape, mRNA cap structure and translation efficiency, siRNA and antisense oligonucleotide (ASO) mechanism of action, microRNA regulatory pathway diagrams, and circular RNA therapeutic platform visualization.
Biomanufacturing and Bioprocess Illustration
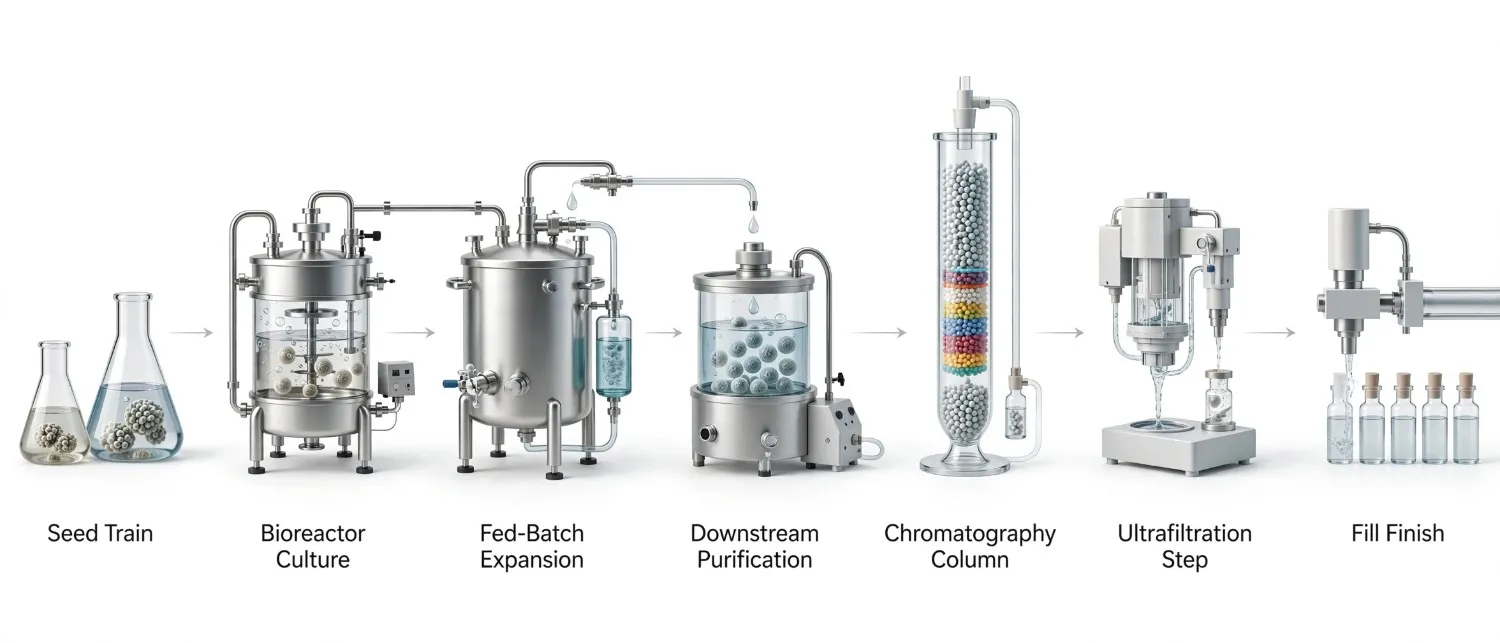
Industrial and biopharmaceutical manufacturing processes require precise technical illustration of: upstream bioprocessing (seed train expansion, bioreactor inoculation and fed-batch culture, perfusion systems), downstream processing (centrifugation, chromatography column architecture, ultrafiltration/diafiltration), fill-and-finish aseptic processing, quality control sampling protocols, and continuous manufacturing flow diagrams. These are used in regulatory manufacturing sections, technology transfer documentation, and investor process validation presentations.
Microbiome and Microbiology Illustration
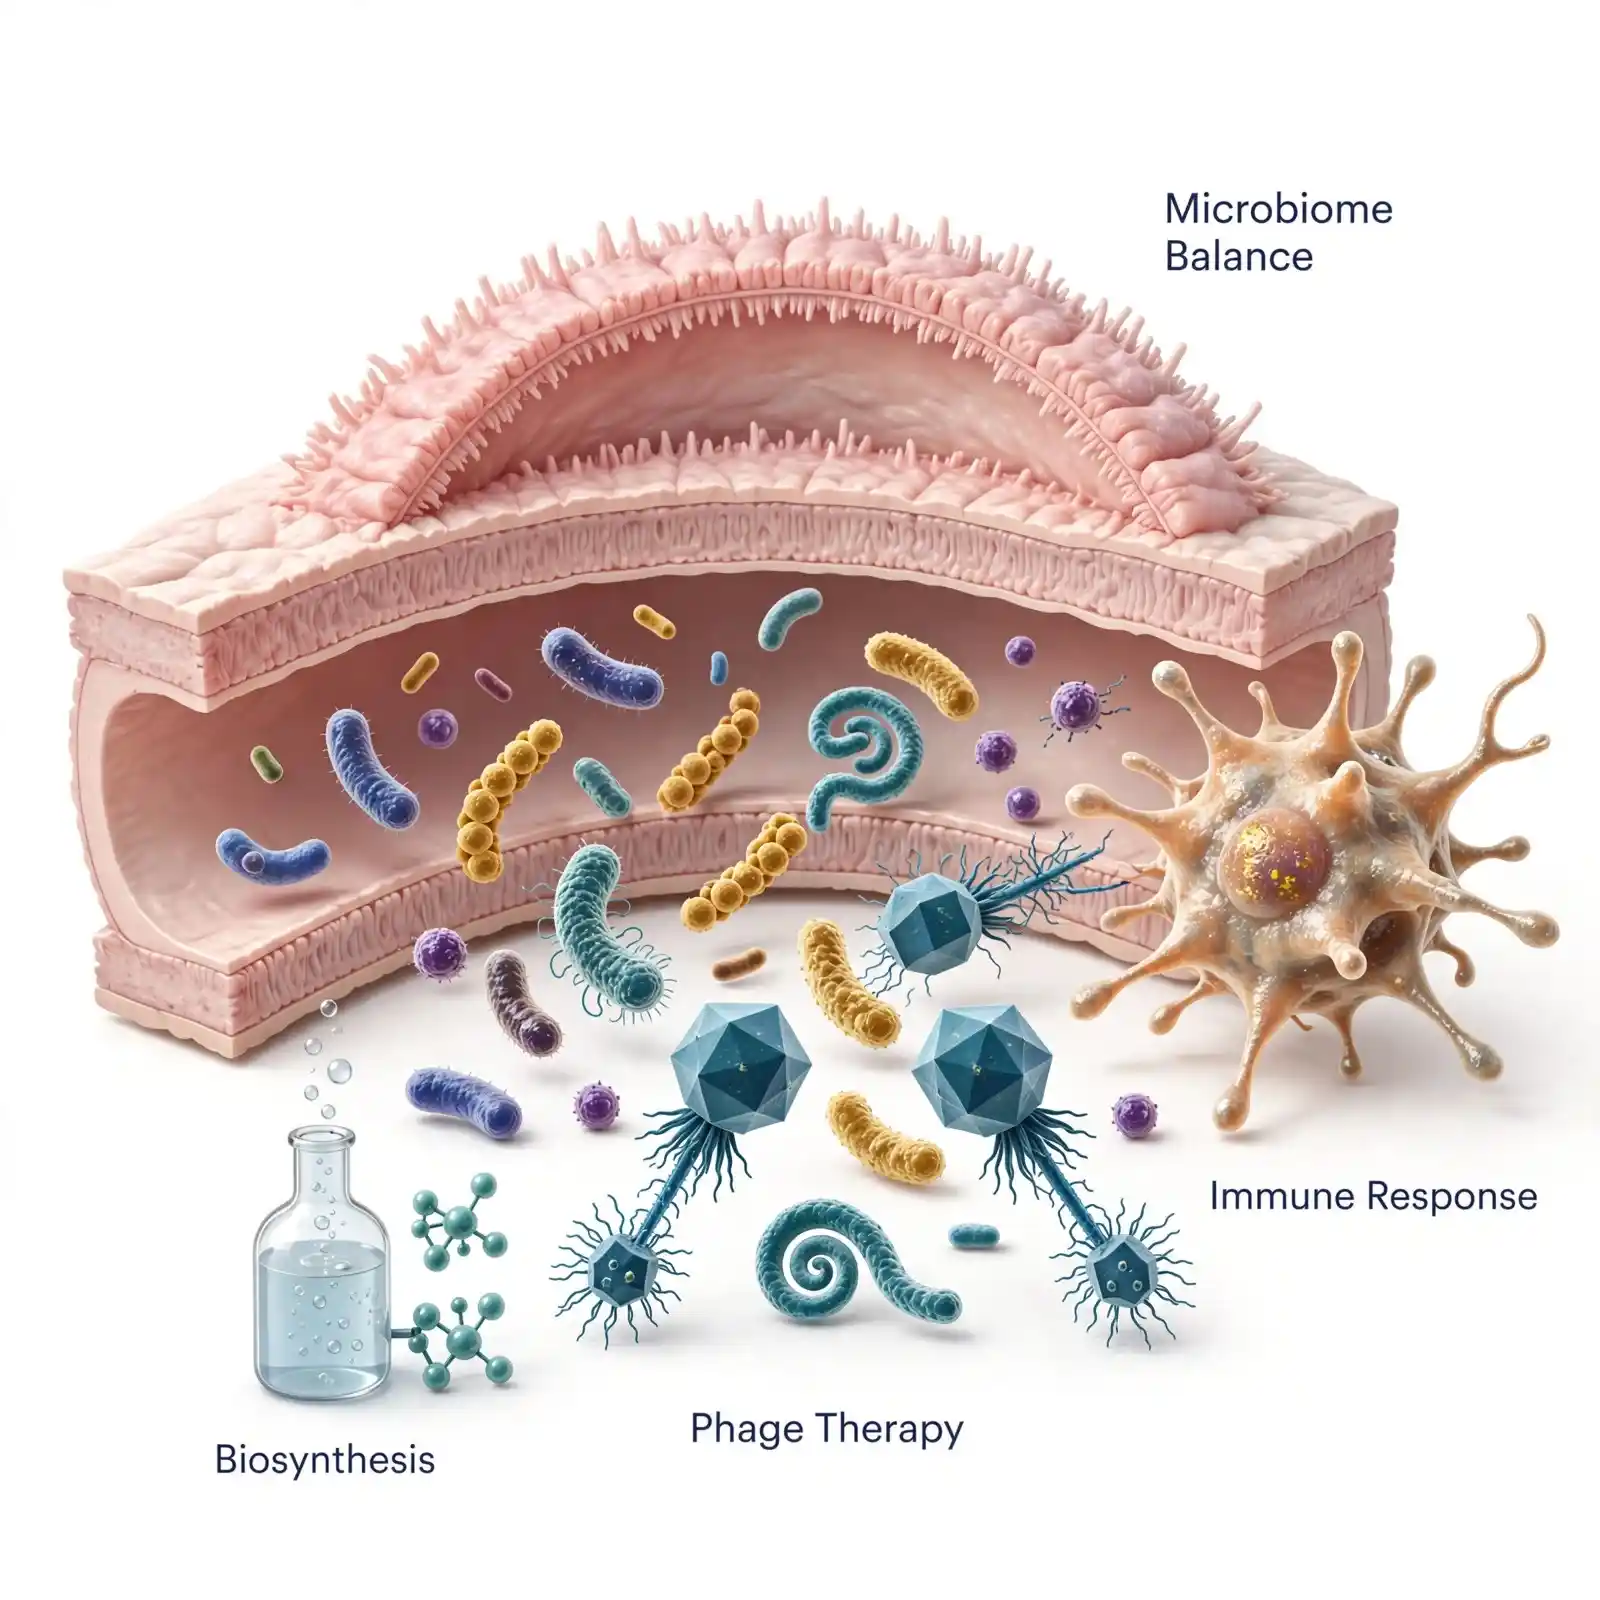
Microbiome-based therapeutics represent one of the most rapidly emerging areas of biotechnology, driving significant advances in precision medicine, infectious disease management, metabolic health, and immune system modulation. Scientific illustration in this field plays a critical role in simplifying complex biological concepts through detailed visualizations, including gut microbiota community ecology diagrams, microbe–immune system interaction pathways, dysbiosis and microbiome restoration processes, bacteriophage therapy mechanisms, fermentation-derived metabolite and biosynthesis pathway mapping, microbial strain interactions, host–microbiome communication networks, and the mechanisms by which beneficial microorganisms influence disease prevention, therapeutic response, and overall human health.
Omics and Systems Biology Visualization
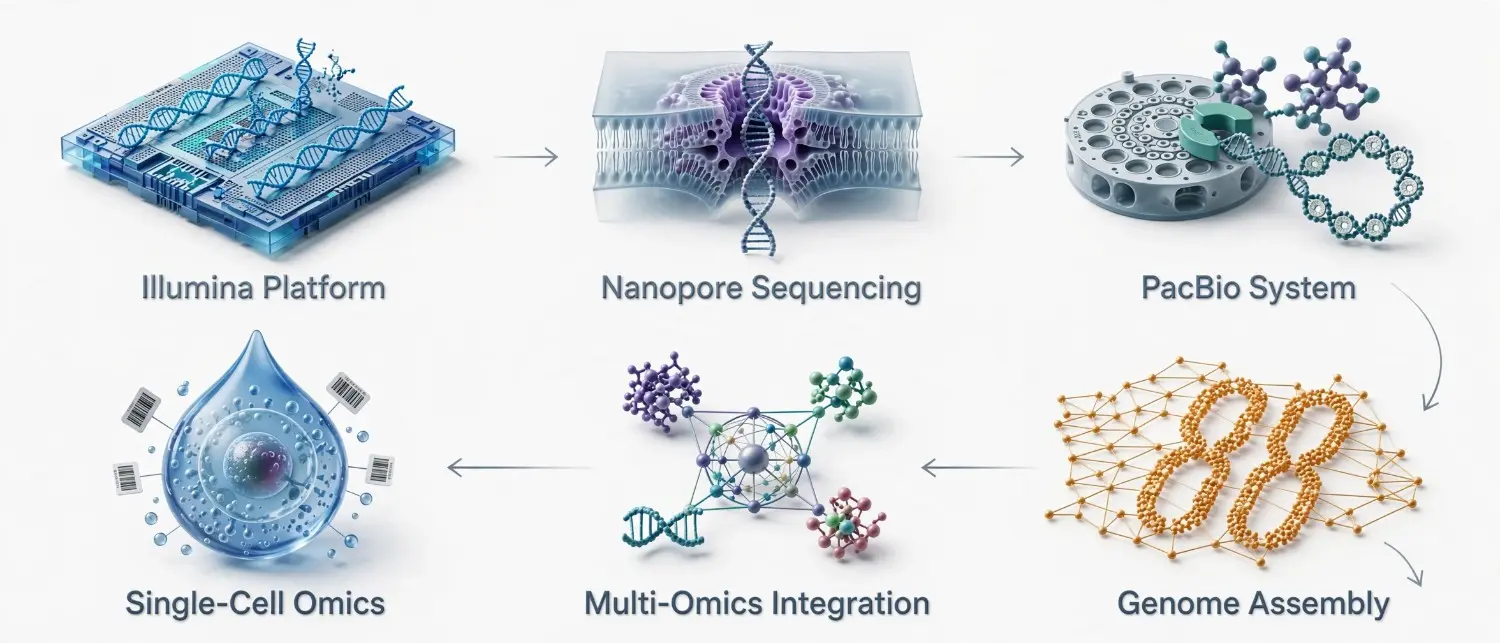
The omics revolution – genomics, transcriptomics, proteomics, metabolomics, and epigenomics – generates data at scales that require sophisticated visual translation. Omics illustration covers: genome assembly and annotation diagrams, sequencing workflow visualization (Illumina, Oxford Nanopore, PacBio), multi-omics data integration pathway maps, and single-cell sequencing workflow diagrams. These are primarily used in publications, grant applications, and research program communication.
Synthetic Biology and Metabolic Engineering Illustration
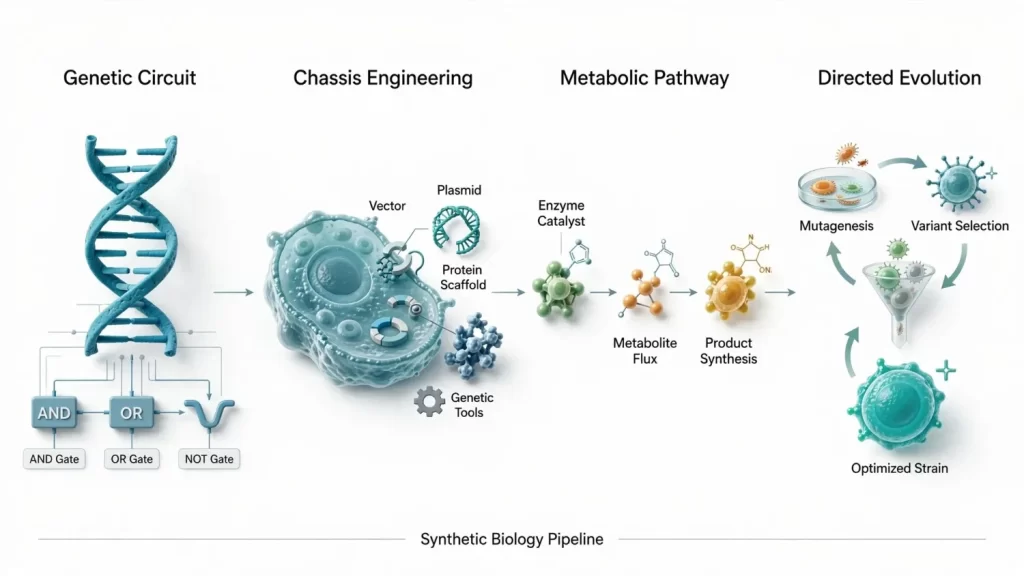
Synthetic biology illustration depicts: genetic circuit design and Boolean logic gate diagrams, metabolic pathway engineering for biofuel or bioplastic production, chassis organism engineering schematics, and directed evolution workflow visualization. These are used in industrial biotech investor materials, patent applications, and academic publications.
Key Applications: Biotechnology Illustration Across the Biotech Lifecycle
Application Table: Illustration Type by Stage and Audience
| Biotech Stage | Illustration Type | Primary Audience |
|---|---|---|
| Discovery and Target ID | Protein structure, target validation diagram, pathway map | Internal R&D teams, scientific advisors |
| Lead Development | Gene editing mechanism, molecular docking, cell model diagram | Research leads, early-stage investors |
| IND/CTA Application | Mechanism of action, delivery system diagram, route-of-administration | FDA, EMA, regulatory affairs |
| Phase I-III Clinical Trials | Cell therapy process, trial design infographic, patient education diagram | Investigators, IRB, patients, ethics committees |
| Regulatory Submission (BLA/MAA) | Full MoA illustration, biomanufacturing process flow, safety mechanism | Regulatory bodies, medical reviewers |
| Investor and Fundraising | Pipeline MoA sequence, platform technology diagram, proof-of-concept visual | VCs, institutional investors, IPO roadshow audiences |
| Scientific Publication | Graphical abstract, conceptual figure, pathway diagram, data visualization | Journal editors, peer reviewers, academic community |
| Patent Application | Molecular structure drawing, process flow, sequence diagram | Patent examiners, IP attorneys |
| Medical Affairs and Launch | HCP education diagram, clinical summary infographic | KOLs, prescribers, payers |
| Patient Communication | Simplified gene therapy or cell therapy explanation | Patients, caregivers, advocacy groups |
What Makes Exceptional Biotechnology Illustration
High-quality biotechnology illustration consistently demonstrates the following characteristics – and the absence of any one of them is immediately visible to scientific audiences.
Molecular geometry fidelity
Every molecular structure depicted must respect the actual three-dimensional geometry of the molecule – secondary structure conventions for proteins, accurate base pair spacing for DNA and RNA, and correct phospholipid bilayer architecture for cell membranes. Illustrators working at this level reference crystallographic databases, published structural biology literature, and client-supplied molecular data files.
Process accuracy in dynamic sequences
Biotechnology illustration frequently depicts processes rather than static structures. A CRISPR editing sequence must show the sgRNA loading into Cas9, the correct protospacer adjacent motif (PAM) recognition, the R-loop formation, and the strand cleavage – in the correct order and with correct molecular geometry at each step.
Scale consistency within panels
Depicting a virus, a cell, an organ, and a whole organism within the same illustration requires deliberate scale convention choices. Professional biotechnology illustration handles scale discontinuity clearly and consistently, using visual cues that signal scale transitions without creating scientific confusion.
Source documentation
The best biotechnology illustrators work from a documented reference list for every molecular interaction shown. This practice – standard in scientific publication figure work but often absent in commercial illustration – is what makes the difference between an illustration that passes peer review and one that generates scientific credibility questions.
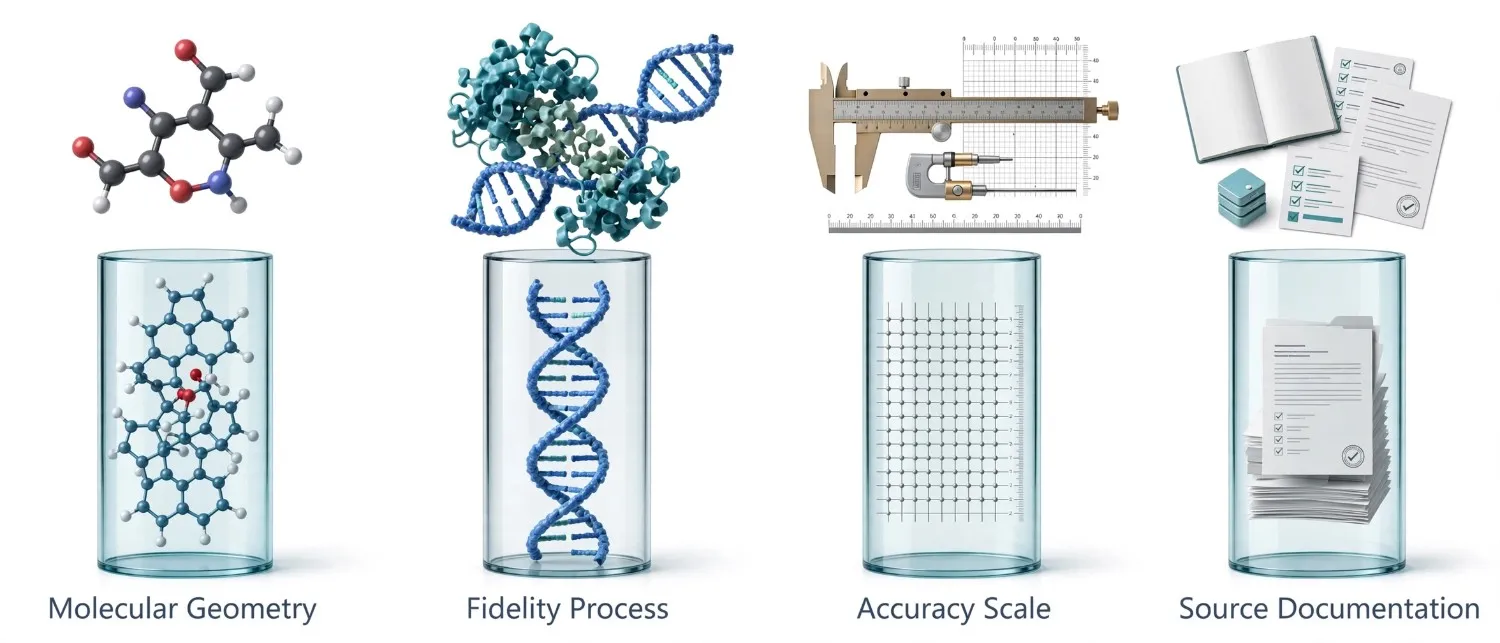
For teams who want to understand what a professionally trained biomedical illustrator actually does, what qualifications they hold, and how they approach source-based scientific accuracy, the detailed overview of what a professional biomedical illustrator does and how they are trained provides a clear professional framework.
The Biotechnology Illustration Production Process: Step by Step
The production of a biotechnology illustration at publication or regulatory grade follows a documented, multi-stage workflow that balances scientific accuracy with communication clarity.
Step 1: Scientific Brief and Reference Collection
The process begins with a comprehensive scientific brief: the specific biological process or mechanism to be depicted, the scientific scale and level of detail required, the intended communication purpose, the target audience’s level of biological literacy, and all available reference materials. Reference packages should include: published papers describing the mechanism, molecular structure files (PDB entries, FASTA sequences, or proprietary data), existing visual benchmarks from relevant publications, and brand or journal style guidelines.
Step 2: Scientific Literature Review and Accuracy Mapping
The illustrator conducts an independent literature review to verify every interaction, structure, and process step that will appear in the illustration. This review maps out: confirmed vs. proposed mechanisms, scale conventions used in the relevant scientific literature, naming conventions for all depicted molecular entities, and any areas of scientific uncertainty that the client needs to decide how to represent.
Step 3: Conceptual Visual Structure and Narrative Design
A rough sketch establishes the visual narrative: what the illustration depicts first, how the viewer’s eye progresses through the content, what the primary scientific takeaway visual is, and how multi-panel sequences connect. For complex gene therapy or cell therapy illustrations, this stage includes a visual storyboard showing each panel’s content and the transitions between them.
Step 4: Scientific Accuracy Review of the Concept
The concept sketch is reviewed by the client’s scientific or regulatory team before detailed rendering begins. Catching conceptual errors at the sketch stage costs a fraction of correcting them in a fully rendered illustration.
Step 5: Detailed Illustration Development
The illustrator builds the full illustration: molecular geometry, cellular architecture, process sequence panels, annotation labels, scale bars, callout arrows, and color coding. At this stage, the illustration is cross-referenced against the source literature for every depicted interaction.
Step 6: Client and Expert Review
The draft illustration is reviewed by the client’s scientific, regulatory, or publication team. For high-stakes applications – FDA submissions, Nature-level publications, investor roadshow decks – external expert review by a subject-matter specialist is strongly recommended at this stage.
Step 7: Revision Cycles and Finalization
Client and expert feedback is incorporated through structured revision rounds. A professional biotechnology illustration studio provides unlimited revisions until every scientific, regulatory, and aesthetic criterion is satisfied without exception.
Step 8: File Delivery in All Required Formats
Final assets are delivered in all specified formats: high-resolution TIFF and JPEG for print and publication use, vector EPS and PDF for scalable applications, optimized PNG and SVG for digital and web, and layered source files (PSD, AI) for future internal adaptation. Full intellectual property ownership transfers to the commissioning organization on delivery.
Common Mistakes Biotech Teams Make with Illustration
These errors consistently undermine both scientific credibility and commercial effectiveness in biotech visual communication.
Mistake 1: Using generic stock biology graphics
Free-to-license cell images and DNA helices communicate nothing specific about your technology platform. Sophisticated scientific audiences interpret generic visuals as a signal that the underlying science lacks distinctiveness.
Mistake 2: Depicting mechanisms without source documentation
An illustration that shows a molecular interaction without a documented scientific source is an illustration that cannot be defended to a peer reviewer, patent examiner, or regulatory reviewer. Source documentation is not optional; it is the scientific foundation of every illustrated claim.
Mistake 3: Conflating 2D process diagrams with 3D molecular visualization
These are distinct tools for distinct communication purposes. A 2D process flow diagram is ideal for showing biomanufacturing steps or clinical trial design. A 3D molecular render is necessary for showing protein conformation, binding pocket geometry, or viral capsid structure. Choosing the wrong format for the communication goal produces confusion, not clarity.
Mistake 4: Producing a single illustration for all audiences
A CRISPR mechanism illustration calibrated for a Nature Methods submission is completely inappropriate for a patient-facing gene therapy consent form. Planning a single illustration to serve all audiences produces a visual that serves none of them well.
Mistake 5: Underinvesting in graphical abstracts
Graphical abstracts are now required or strongly recommended by most high-impact journals. They are also the most-viewed element of any published paper. Producing a graphical abstract at the same quality level as the paper’s scientific content is not optional for labs competing for citation and impact in competitive research areas.
Mistake 6: Treating illustration as a post-funding activity
The best biotech illustration programs begin during seed or Series A, when the company’s platform technology needs to be visualized for investor comprehension. Illustration produced at this stage pays dividends across every subsequent financing and communication event.
For a full examination of the practical benefits scientific illustration delivers to research and commercial teams across the biotech and life sciences sector, the linked resource covers the evidence base comprehensively.
Expert Tips for Biotech Teams Commissioning Illustration
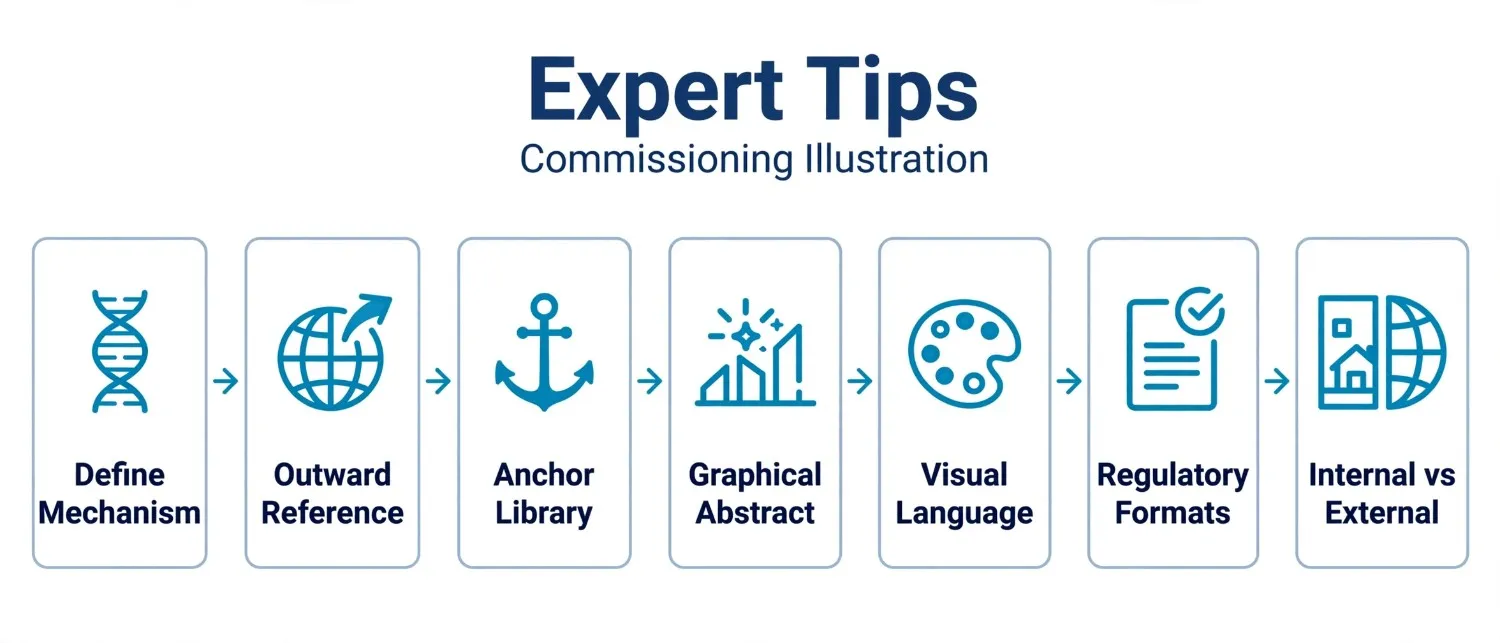
These recommendations apply across biotech sub-sectors and pipeline stages.
Tip 1: Build your illustration library from the platform mechanism outward
Every biotech company has a core platform mechanism – the fundamental biological insight that makes the technology work. Illustrating this mechanism first, at maximum scientific accuracy, creates a foundational asset that supports every subsequent communication: investor decks, publications, patent applications, and regulatory submissions.
Tip 2: Use your published papers as reference anchors
Every mechanism depicted in a biotechnology illustration should be traceable to a published paper, a clinical data package, or a formally reviewed internal document. Building this traceability into the illustration brief protects the company legally, scientifically, and regulatorily.
Tip 3: Commission the graphical abstract at the same time as the paper
The best time to produce a graphical abstract is when the paper’s lead author and the illustrator can work together before submission, while the key finding is fresh and the scientific narrative is clear. Post-acceptance graphical abstracts consistently underperform pre-submission ones.
Tip 4: Invest in a consistent molecular visual language across all materials
Define early: the color conventions for your key therapeutic cell types, the visual representation of your delivery system, and the iconography for your target molecule. Consistency across all illustration materials creates a recognizable visual identity that reinforces your platform’s distinctiveness at every stakeholder touchpoint.
Tip 5: Plan for regulatory format requirements at the brief stage
FDA and EMA have specific formatting requirements for illustrations used in regulatory submissions. Resolution minimums, color mode specifications (RGB vs. CMYK), font embedding rules, and callout annotation conventions all need to be specified at the brief stage, not discovered after delivery.
Tip 6: Distinguish between internal R&D illustrations and external communication illustrations
Internal schematics used for team scientific alignment can be rough and diagrammatic. External investor, regulatory, and publication illustrations require full professional production quality. Using internal schematics in external communication is one of the most common – and most costly – biotech visual communication errors.
For teams wanting to understand the broader role of three-dimensional rendering in biotechnology and how it differs from 2D schematic illustration, the detailed breakdown of how 3D biomedical visualization works at the structural level provides a clear technical comparison.
Biotechnology Illustration vs. Generic Scientific Graphics: Comparison Table
| Criteria | Professional Biotechnology Illustration | Generic Scientific Stock Graphics |
|---|---|---|
| Molecular accuracy | Sourced from peer-reviewed literature and structural data | Approximate; not verified against current science |
| Platform specificity | Depicts your specific mechanism, molecule, or process | Generic biological imagery with no platform relevance |
| Regulatory suitability | Suitable for FDA/EMA IND, BLA, gene therapy submissions | Not suitable for regulatory documentation |
| Publication suitability | Meets journal graphical abstract and figure standards | Not acceptable as original scientific content |
| Patent application use | Appropriate for IP filing with documented source accuracy | Insufficient for patent application requirements |
| Audience calibration | Produced in multiple versions for different audiences | One generic version for all uses |
| IP ownership | Full transfer on delivery; no licensing restrictions | Licensed stock; IP remains with the library |
| Revision capability | Unlimited revisions through expert review cycles | No revision available |
| Scientific credibility | Signals scientific rigor to all technical audiences | Signals lack of proprietary platform differentiation |
| Application range | R&D, regulatory, investor, publication, patient, patent | Stock website and basic presentation use only |
Frequently Asked Questions About Biotechnology Illustration
What is biotechnology illustration?
Biotechnology illustration is a specialized discipline of scientific visual communication that produces molecularly precise, biologically accurate graphic representations of living systems, genetic processes, cellular mechanisms, biomanufacturing workflows, and therapeutic modalities. It is used across biotech investor presentations, regulatory submissions, scientific publications, patent applications, clinical trial materials, and patient communication programs. The discipline requires illustrators trained in molecular and cell biology, genetics, biochemistry, and bioprocess science alongside visual communication and illustration expertise.
How is biotechnology illustration different from medical illustration?
Medical illustration primarily depicts human anatomy, surgical procedures, medical devices, and pharmaceutical mechanisms in clinical and commercial contexts. Biotechnology illustration is a distinct specialization focused on living biological systems and biotechnological processes: gene editing, cell engineering, protein structure, biomanufacturing, and omics data visualization. While the two disciplines overlap in areas such as gene therapy and cell therapy communication, biotechnology illustration requires deeper engagement with molecular biology, genetics, biochemistry, and bioprocess engineering than standard medical illustration typically demands. For a clear overview of the broader discipline within which both sit, the comprehensive guide to biomedical visual communication provides a thorough foundational reference.
What types of biotechnology illustration are most commonly commissioned?
The most frequently commissioned types are: mechanism-of-action illustrations for gene therapy and cell therapy programs, CRISPR and gene editing mechanism diagrams, CAR-T and other cell therapy engineering workflow illustrations, graphical abstracts for high-impact journal publications, biomanufacturing process flow diagrams for regulatory submissions, molecular and protein structure illustrations for patent applications, and investor presentation pipeline visualization sequences. Demand for all of these categories has grown substantially alongside the rapid clinical and commercial expansion of advanced therapy medicinal products (ATMPs).
Can biotechnology illustrations be used in FDA and EMA regulatory submissions?
Yes. Professionally produced biotechnology illustrations are used extensively in IND applications, BLA submissions, gene therapy product dossiers, and ATMP authorization packages. They must accurately represent the described mechanism, comply with the formatting and resolution requirements of the relevant regulatory authority, and not overstate efficacy or misrepresent any aspect of the biological mechanism. Illustrations used in regulatory submissions should carry documented scientific references for every depicted molecular interaction.
How long does a biotechnology illustration project take to produce?
Timeline varies significantly with scope. A single graphical abstract for a journal submission typically requires 5-7 business days. A complete CRISPR mechanism illustration with multiple sequential panels requires 2-3 weeks. A full biotechnology illustration package for a Series B investor roadshow – covering platform mechanism, delivery system, pipeline MoA sequence, and disease state context – typically requires 4-8 weeks, depending on the number of scientific review cycles and the complexity of the biological content.
What scientific reference materials does a biotechnology illustrator need?
Core references include: published papers documenting the mechanism to be illustrated, molecular structure files from the RCSB Protein Data Bank where relevant, vector genome maps or construct schematics for gene therapy illustrations, manufacturing process descriptions for bioprocess illustrations, and any proprietary molecular or process data the client can share under NDA. The more complete the scientific reference package, the faster and more accurate the first draft will be.
How important are graphical abstracts for biotech publications?
Extremely important. The world’s leading life sciences journals – including Nature, Cell, Science, and their family journals – now require or strongly recommend graphical abstracts with every submission. These figures are the first visual a reader encounters; they directly determine whether a paper receives a full read or is passed over. In competitive research areas where dozens of papers address similar questions, a high-quality biotechnology illustration as a graphical abstract measurably improves citation rates and research program visibility.
What is the difference between biotechnology illustration and biotechnology animation?
Biotechnology illustration produces static or sequential-panel visual assets suitable for all media: print publications, regulatory documents, investor slides, websites, and patent filings. Biotechnology animation produces dynamic video content showing biological processes in motion over time. Both serve important communication purposes, but they differ in production timelines, budget requirements, media suitability, and regulatory application scope. For research teams and biotech companies weighing both options, this detailed breakdown of how scientific illustration and medical animation differ from each other clarifies the decision criteria comprehensively.
How do biotechnology illustrations support patent applications?
Patent applications for biotechnology inventions – particularly gene therapy constructs, novel protein engineering methods, biomanufacturing processes, and synthetic biology circuits – frequently require technical illustrations that visually document the invention with specificity. Biotechnology illustrations in patent filings must be produced to patent office drawing standards (USPTO, EPO, PCT): black and white line art for most jurisdictions, specific line weight conventions, reference numeral callout requirements, and cross-section conventions for depicting internal molecular or device architecture. These are a distinct deliverable format from commercial or publication illustrations.
Biotechnology Illustration is How Invisible Science Becomes Impactful
Biotechnology operates at the frontier of what human biology can do – and at scales that make verbal description fundamentally inadequate as a communication tool. Gene editing events happening within a Cas9 protein. Engineered T cells hunting tumour antigens. Lipid nanoparticles releasing mRNA payloads inside a hepatocyte. None of this is visible. All of it needs to be understood.
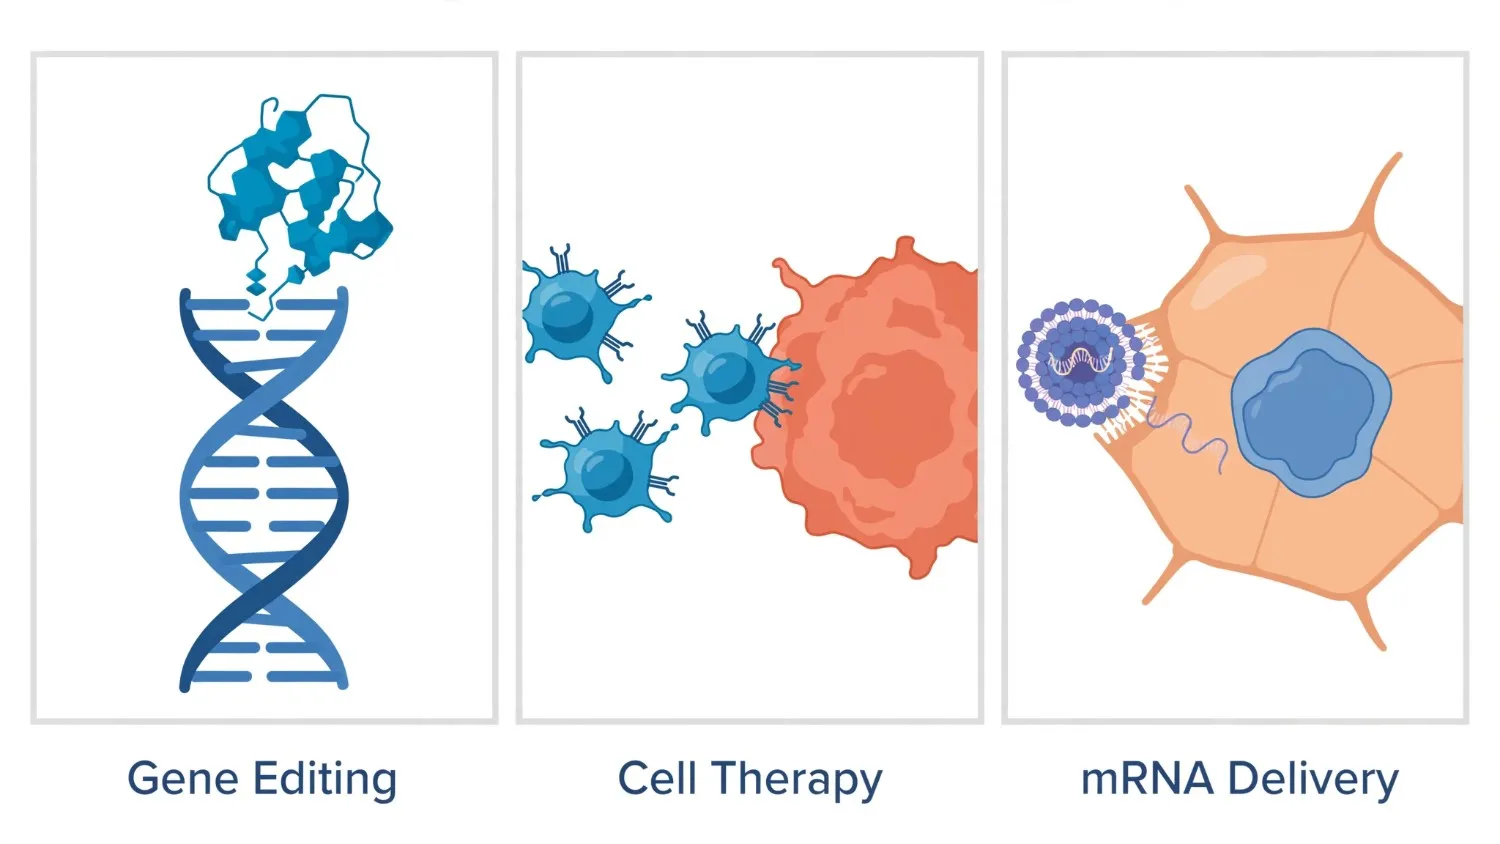
Biotechnology illustration makes the invisible visible. It transforms molecular precision into investor conviction, regulatory clarity, peer-reviewed credibility, and patient comprehension. It is not a peripheral visual service that biotech companies commission when they have leftover budget. It is the primary communication infrastructure that determines whether a platform technology is understood, funded, approved, and adopted.
The biotech organizations that treat visual communication as a core scientific and commercial investment – building consistent, source-documented illustration libraries from their earliest platform development stages – consistently outperform those that treat illustration as a last-minute presentation polish task. Their regulatory submissions are cleaner. Their investor presentations are more compelling. Their publications achieve higher citation impact. And their clinical programs generate better-informed investigators and more adherent patients.
For teams preparing scientific visualization and illustration for research, building investor decks, planning regulatory submissions, or developing clinical education materials, the quality of the biotechnology illustration that represents your science directly determines how far that science travels.